
- PREMIUM
- LIVE QUOTES
- INSTITUTIONS
 Index Options
 State Street
 CME Group
 Nasdaq
 Cboe
Cboe TradingView
 Wall Street Journal
Is It Time To Reassess NRG Energy (NRG) After Its Recent Share Price Pullback?
- If you are wondering whether NRG Energy at around US$148.91 is still offering value or starting to look fully priced, you are not alone.
- The share price has pulled back with a 6.5% decline over the last week and a 9.3% decline over the last month, although the 1 year return sits at 53.2% and the 3 year return is a very large gain.
- Recent coverage has focused on how NRG Energy fits into the US utilities sector and what its share price history suggests about investor expectations, which helps frame these recent moves. Analysts and commentators have also been looking at its capital allocation track record and business mix to understand what the current price may be reflecting.
- On our valuation checks, NRG Energy scores 3 out of 6, giving it a valuation score of 3. Next, we will walk through how different methods line up on value today and then finish by looking at a more complete way to think about what the stock could be worth.
Approach 1: NRG Energy Discounted Cash Flow (DCF) Analysis
A Discounted Cash Flow model takes the cash flows a company is expected to generate in the future and then discounts them back to today to estimate what the entire business could be worth in present value terms.
For NRG Energy, the latest twelve month Free Cash Flow is about $2.03b. Analysts have provided forecasts out to 2030, with Simply Wall St extrapolating further years to build a ten year view. Within this, projected annual Free Cash Flow figures run in the $3b to $5.9b range over the next decade, including a forecast of $4.91b in 2030.
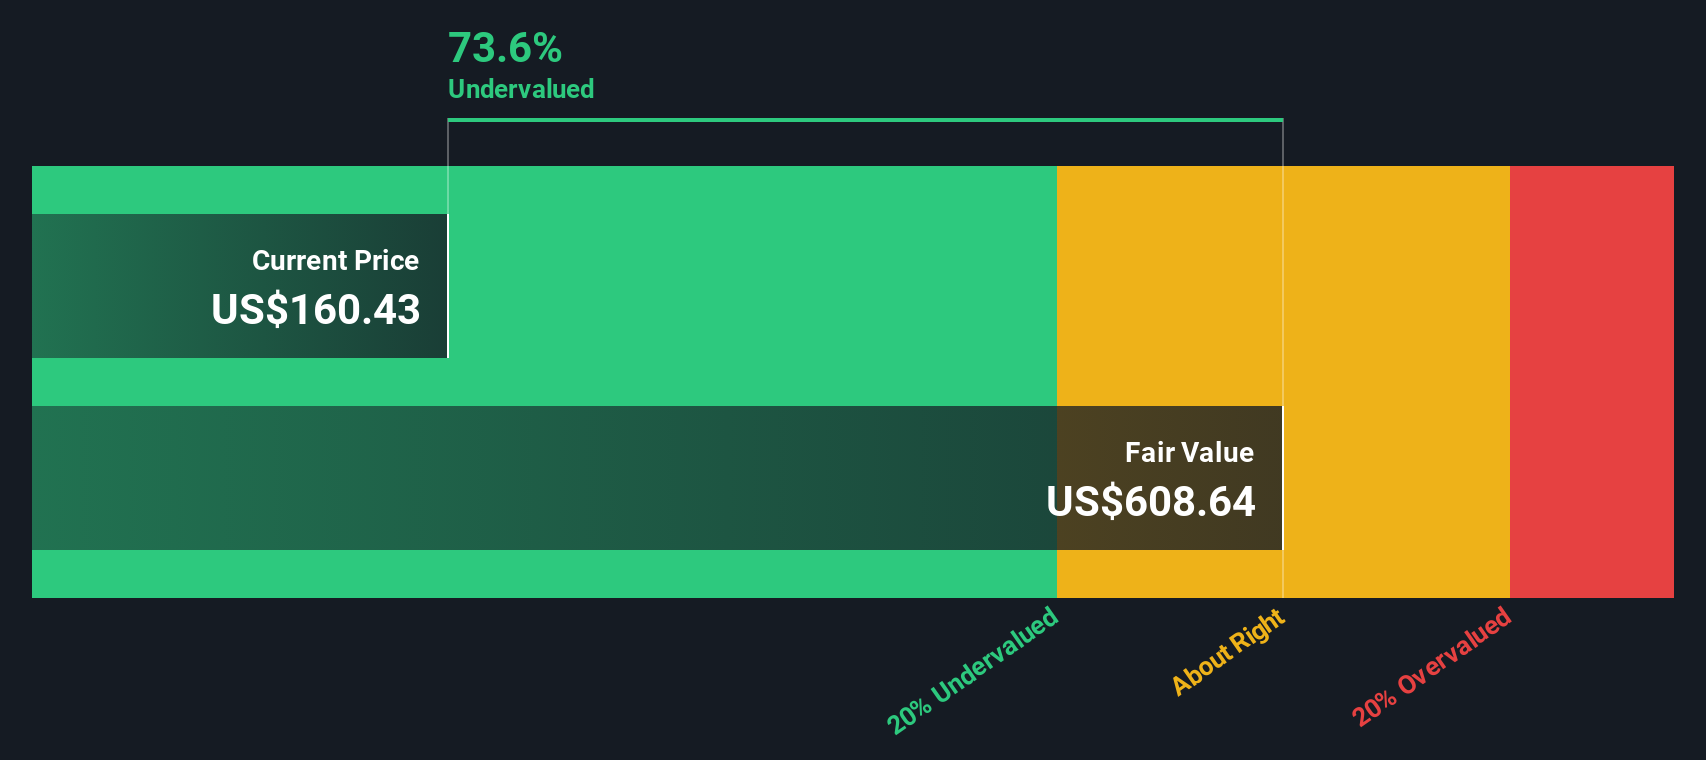
Using a 2 Stage Free Cash Flow to Equity model, these cash flows are discounted and aggregated to produce an estimated intrinsic value of $611.35 per share. Compared with the recent share price of about $148.91, the DCF output suggests the stock is 75.6% undervalued on this set of assumptions.
Result: UNDERVALUED
Our Discounted Cash Flow (DCF) analysis suggests NRG Energy is undervalued by 75.6%. Track this in your watchlist or portfolio, or discover 884 more undervalued stocks based on cash flows.
Approach 2: NRG Energy Price vs Earnings (P/E)
For profitable companies like NRG Energy, the P/E ratio is a useful shorthand for how much investors are paying for each dollar of current earnings. It ties the share price directly to the bottom line, which is what ultimately supports long term returns.
What counts as a “normal” P/E depends on what investors expect for future growth and how much risk they see in the business. Higher expected growth or lower perceived risk can support a higher P/E, while slower growth or higher risk usually calls for a lower one.
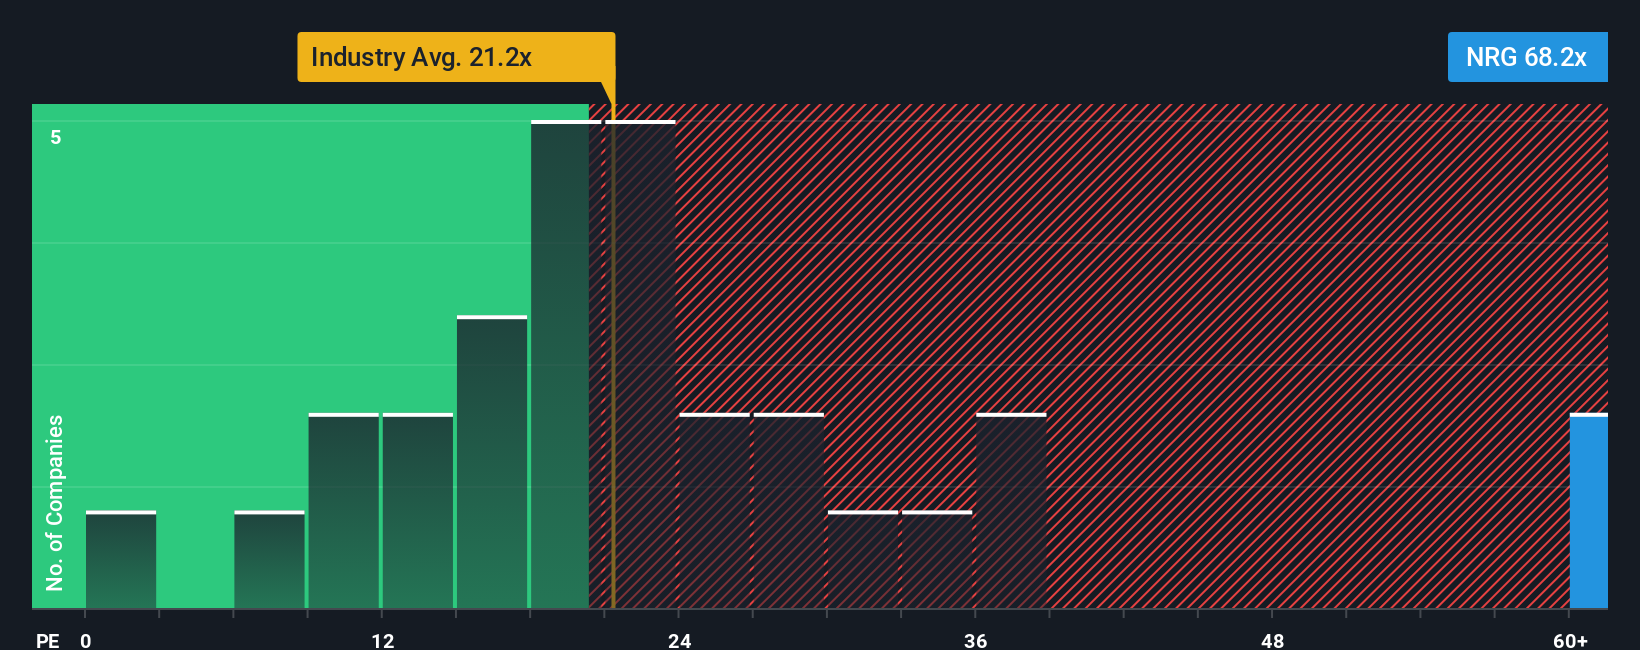
NRG Energy is currently trading on a P/E of about 20.77x. That sits close to the Electric Utilities industry average of 19.98x and the peer average of 19.41x, so on simple comparisons it is not far from the pack. Simply Wall St’s Fair Ratio for NRG Energy is 31.83x, which is their proprietary estimate of what the P/E would be if the market fully reflected factors like earnings growth, profit margins, industry, market cap and company specific risks.
Because the Fair Ratio blends these company specific drivers, it can be more informative than a straight comparison with peers or the sector alone. With the Fair Ratio of 31.83x above the current P/E of 20.77x, this framework points to the shares trading below that indicative level.
Result: UNDERVALUED
P/E ratios tell one story, but what if the real opportunity lies elsewhere? Discover 1444 companies where insiders are betting big on explosive growth.
Upgrade Your Decision Making: Choose your NRG Energy Narrative
Earlier we mentioned that there is an even better way to think about valuation. On Simply Wall St you can use Narratives on the Community page to tell your story for NRG Energy in plain language, link that story to your own forecasts for revenue, earnings and margins, and see a Fair Value that updates automatically as new news or earnings arrive. You can then compare that Fair Value with the current price to help inform your decision, whether you lean toward a higher Fair Value closer to about US$203 if you think data center demand, smart home integration and capital allocation will support stronger outcomes, or a lower Fair Value nearer US$92 if you are more cautious about natural gas exposure, execution risks and sector sentiment.
Do you think there's more to the story for NRG Energy? Head over to our Community to see what others are saying!

This article by Simply Wall St is general in nature. We provide commentary based on historical data and analyst forecasts only using an unbiased methodology and our articles are not intended to be financial advice. It does not constitute a recommendation to buy or sell any stock, and does not take account of your objectives, or your financial situation. We aim to bring you long-term focused analysis driven by fundamental data. Note that our analysis may not factor in the latest price-sensitive company announcements or qualitative material. Simply Wall St has no position in any stocks mentioned.
Have feedback on this article? Concerned about the content? Get in touch with us directly. Alternatively, email editorial-team@simplywallst.com