
- PREMIUM
- LIVE QUOTES
- INSTITUTIONS
 Index Options
 State Street
 CME Group
 Nasdaq
 Cboe
Cboe TradingView
 Wall Street Journal
Is It Too Late To Consider Vertiv Holdings Co (VRT) After Its Strong Multi Year Run
- If you are wondering whether Vertiv Holdings Co at US$171.54 is still priced reasonably or already stretched, you are not alone.
- The stock has been volatile recently, with a 5.9% gain over the last 7 days, a 7.6% decline over 30 days, a 2.3% decline year to date, and a 32.9% return over the past year, while its 3 year and 5 year returns are described as very large.
- These swings have kept Vertiv on many investors' watchlists, as rapid multi year moves often prompt questions about what is already priced in. Rather than relying on headlines, it can be useful to step back and see how the current share price lines up with different measures of underlying value.
- Simply Wall St's valuation model currently gives Vertiv a value score of 1 out of 6, which suggests only one of six checks indicates the shares look undervalued. Next, we will walk through the main valuation approaches and then finish with a way to put them all into a clearer story.
Vertiv Holdings Co scores just 1/6 on our valuation checks. See what other red flags we found in the full valuation breakdown.
Approach 1: Vertiv Holdings Co Discounted Cash Flow (DCF) Analysis
A Discounted Cash Flow, or DCF, model takes estimates of a company’s future cash flows and discounts them back to today’s dollars to arrive at an intrinsic value per share.
For Vertiv Holdings Co, the model used is a 2 Stage Free Cash Flow to Equity approach. Vertiv’s latest twelve month free cash flow is about $1.36b. Analyst and extrapolated projections supplied to Simply Wall St show free cash flow estimates rising into the low to mid single billions over the next decade, reaching a projected $4.63b in 2030. These ten year forecasts are a mix of analyst inputs for the earlier years and extrapolations for the later years.
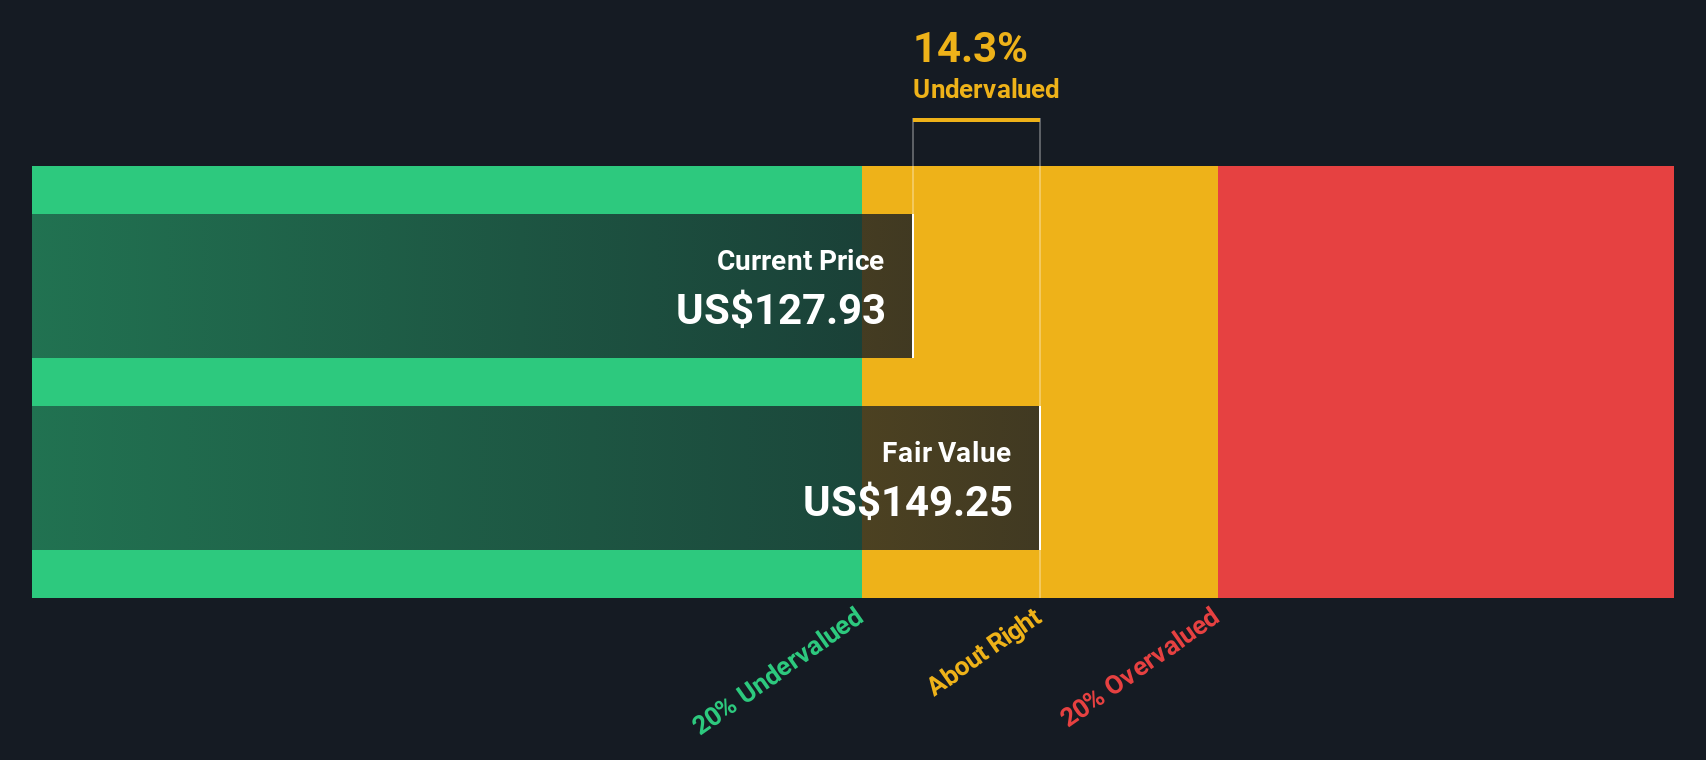
When those projected cash flows are discounted back to today using the model’s assumptions, Simply Wall St arrives at an estimated intrinsic value of about $188.31 per share. Compared with the current share price of $171.54, this implies the shares trade at roughly an 8.9% discount to that DCF estimate, which is a relatively small gap.
Result: ABOUT RIGHT
Vertiv Holdings Co is fairly valued according to our Discounted Cash Flow (DCF), but this can change at a moment's notice. Track the value in your watchlist or portfolio and be alerted on when to act.
Approach 2: Vertiv Holdings Co Price vs Earnings
For a profitable company, the P/E ratio is a straightforward way to see how much investors are paying for each dollar of current earnings. It is popular because it links the share price directly to the bottom line that ultimately supports returns to shareholders.
What counts as a “normal” P/E depends on how quickly earnings are expected to grow and how risky those earnings are. Faster, more predictable growth usually justifies a higher multiple, while slower or more uncertain earnings often line up with a lower one.
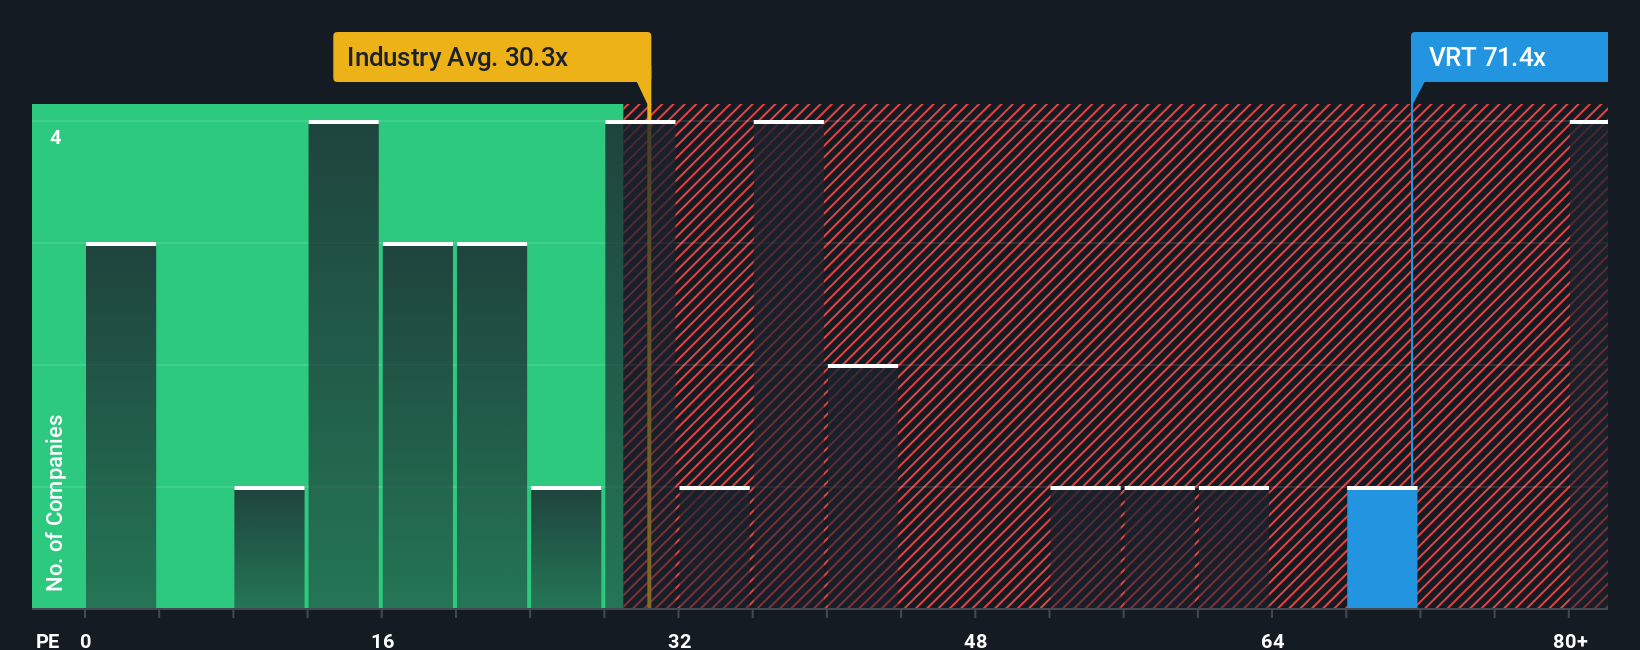
Vertiv is currently trading on a P/E of 63.4x. That sits above the Electrical industry average P/E of about 31.2x and above the peer group average of 38.3x, so the market is clearly assigning a richer multiple than these broad benchmarks.
Simply Wall St’s Fair Ratio framework estimates what a more tailored P/E might look like, given Vertiv’s earnings growth profile, industry, profit margins, market cap and risk characteristics. This Fair Ratio comes out at 52.9x. This aims to be more specific than a simple comparison with peers or the industry, because it adjusts for company level factors rather than treating all firms as alike.
Against that 52.9x Fair Ratio, Vertiv’s current 63.4x P/E screens as materially higher. This suggests the shares look expensive on this metric.
Result: OVERVALUED
P/E ratios tell one story, but what if the real opportunity lies elsewhere? Discover 1443 companies where insiders are betting big on explosive growth.
Upgrade Your Decision Making: Choose your Vertiv Holdings Co Narrative
Earlier we mentioned that there is an even better way to understand valuation, so let us introduce you to Narratives. These are simple stories on Simply Wall St’s Community page that tie your view of Vertiv’s future revenue, earnings and margins to a forecast and a fair value, then compare that fair value with today’s price to help you decide whether the shares look attractive or not. They keep that view automatically updated when new news or earnings arrive, and show how different investors can see the same company in very different ways. For example, one Vertiv Narrative on the platform currently anchors on a fair value of US$196.83 per share, while another points to a much lower figure of US$119.00, reflecting contrasting expectations even though the underlying data is shared and transparent.
Do you think there's more to the story for Vertiv Holdings Co? Head over to our Community to see what others are saying!

This article by Simply Wall St is general in nature. We provide commentary based on historical data and analyst forecasts only using an unbiased methodology and our articles are not intended to be financial advice. It does not constitute a recommendation to buy or sell any stock, and does not take account of your objectives, or your financial situation. We aim to bring you long-term focused analysis driven by fundamental data. Note that our analysis may not factor in the latest price-sensitive company announcements or qualitative material. Simply Wall St has no position in any stocks mentioned.
Have feedback on this article? Concerned about the content? Get in touch with us directly. Alternatively, email editorial-team@simplywallst.com