
- PREMIUM
- LIVE QUOTES
- INSTITUTIONS
 Index Options
 State Street
 CME Group
 Nasdaq
 Cboe
Cboe TradingView
 Wall Street Journal
Has Goldman Sachs (GS) Run Too Far After Its Recent Share Price Surge?
- If you are wondering whether Goldman Sachs Group's share price still offers value after a strong run, this article walks through what the numbers actually say about the stock.
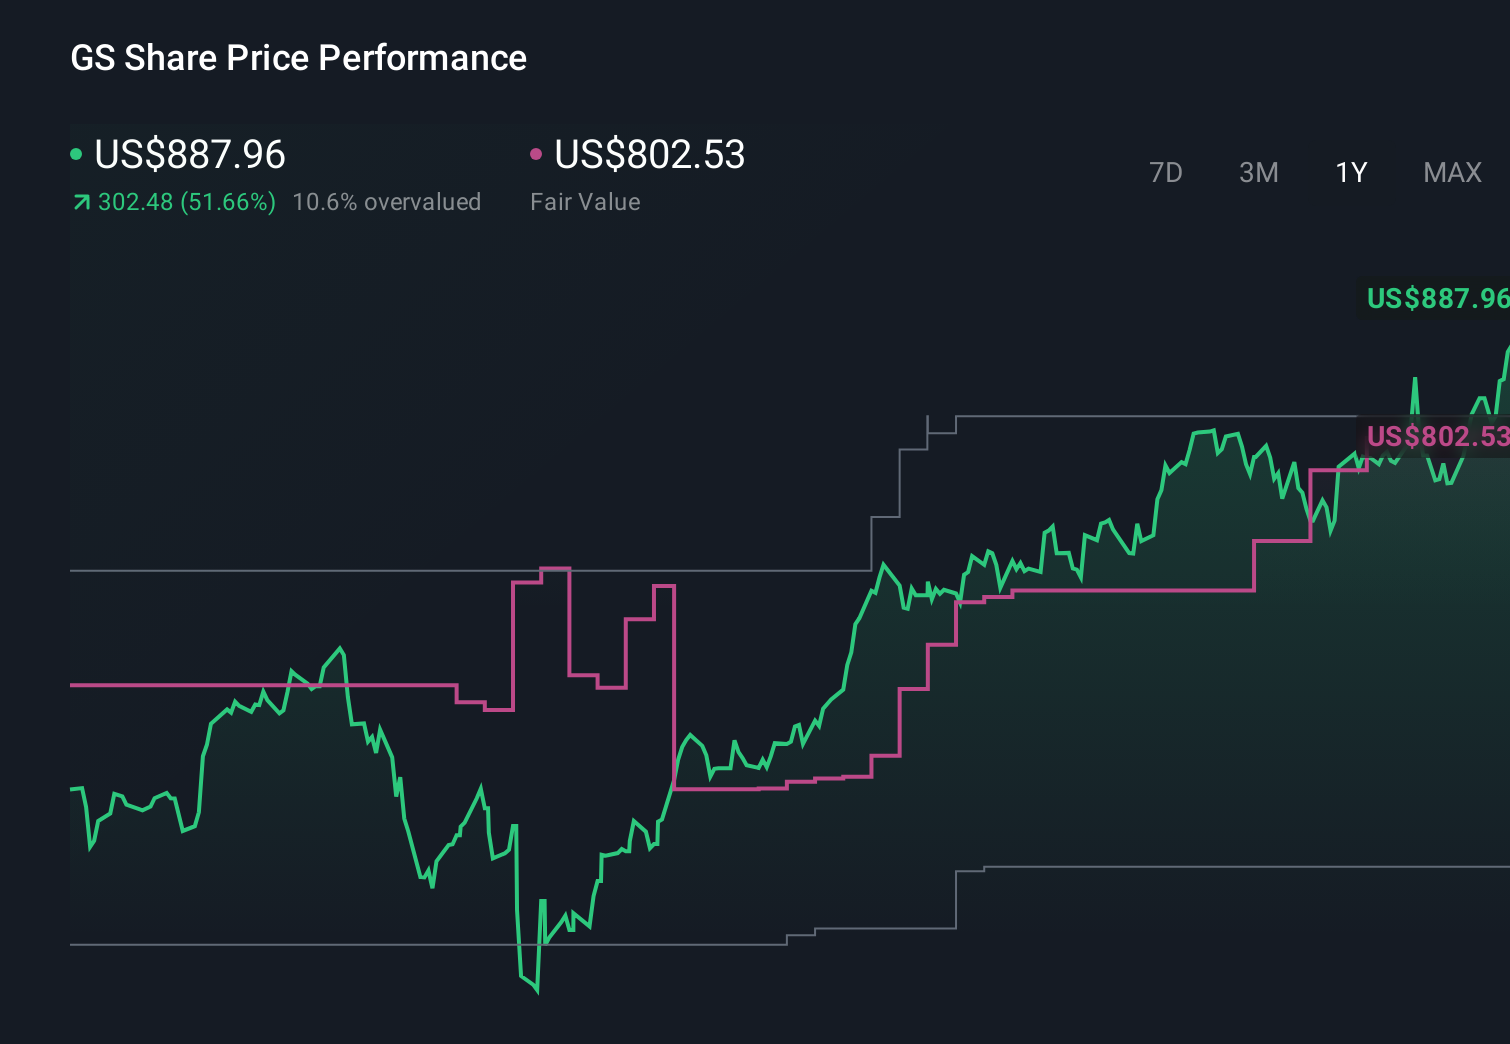
- Goldman Sachs Group recently closed at US$941.02, with returns of 7.1% over 7 days, 8.6% over 30 days, 2.9% year to date, 65.6% over 1 year and 178.4% over 3 years, as well as 249.8% over 5 years. This naturally raises questions about what is already priced in.
- Recent coverage of Goldman Sachs Group has focused on how a higher share price can reshape expectations for future performance and risk, as investors reassess what they are willing to pay for large financial institutions. This context matters for valuation because it affects how you interpret ratios like P/E and P/B, relative to both the company’s own history and peers.
- On our framework of six valuation checks, Goldman Sachs Group scores 3 out of 6. Next we will look at what the standard valuation approaches say about that score, before finishing with a more holistic way to think about the company’s value.
Approach 1: Goldman Sachs Group Excess Returns Analysis
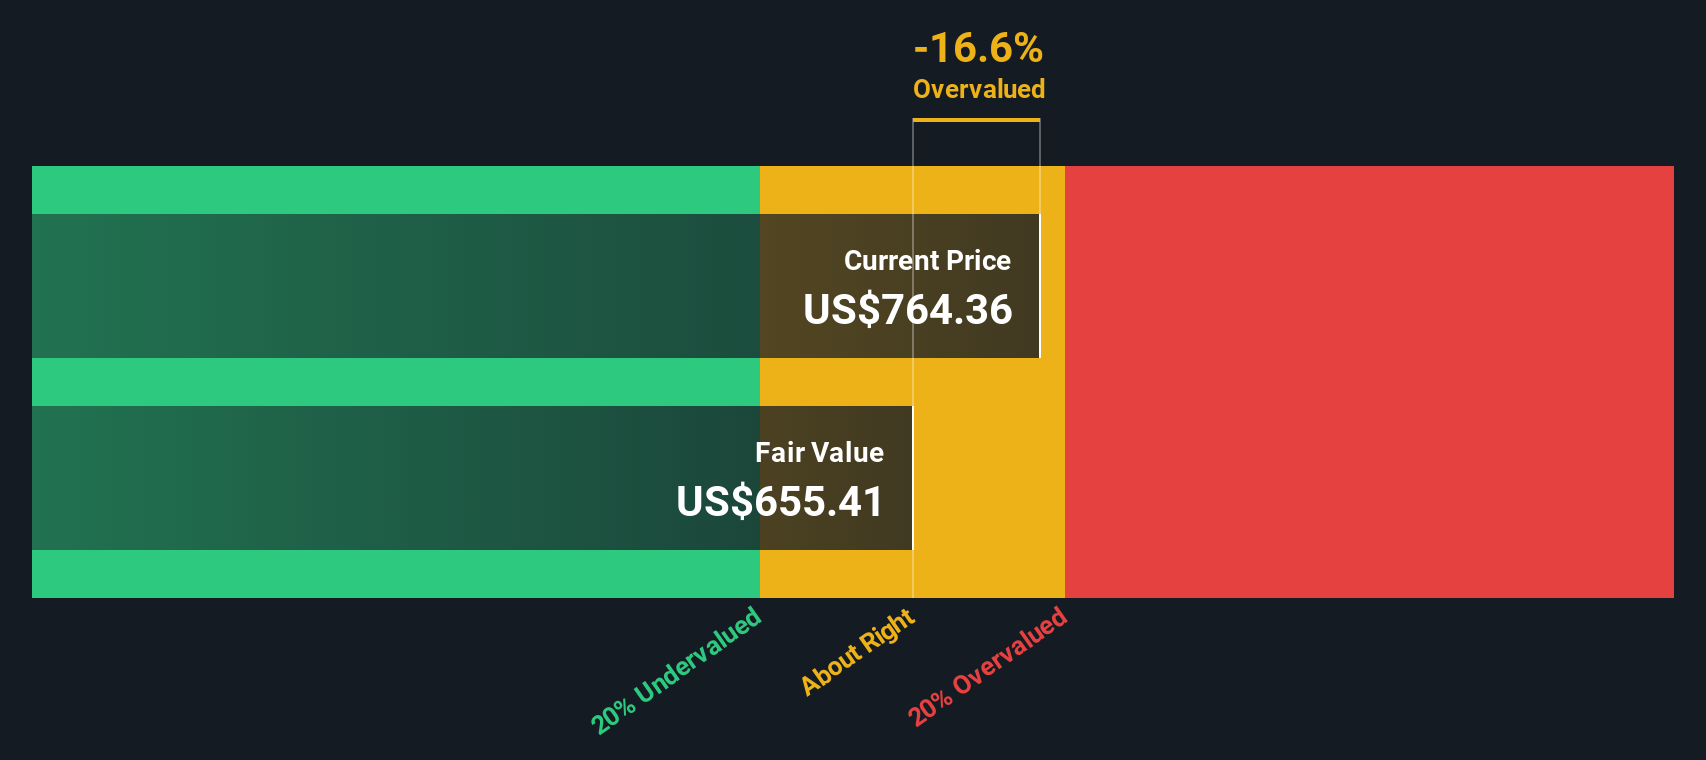
The Excess Returns model looks at how much profit Goldman Sachs Group is expected to earn above the return that shareholders require, based on the company’s equity risk. It uses book value and future profitability to estimate what today’s share price might justify.
For Goldman Sachs Group, the model uses a Book Value of $348.02 per share and a Stable EPS of $64.28 per share, based on weighted future Return on Equity estimates from 13 analysts. The Cost of Equity is $50.54 per share, which implies an Excess Return of $13.74 per share. That excess is built on an Average Return on Equity of 15.90% and a Stable Book Value of $404.30 per share, sourced from weighted future Book Value estimates from 15 analysts.
Putting this together, the Excess Returns model arrives at an intrinsic value of about $553.03 per share. Compared with the recent share price of $941.02, this indicates the stock is around 70.2% overvalued on this framework.
Result: OVERVALUED
Our Excess Returns analysis suggests Goldman Sachs Group may be overvalued by 70.2%. Discover 884 undervalued stocks or create your own screener to find better value opportunities.
Approach 2: Goldman Sachs Group Price vs Earnings
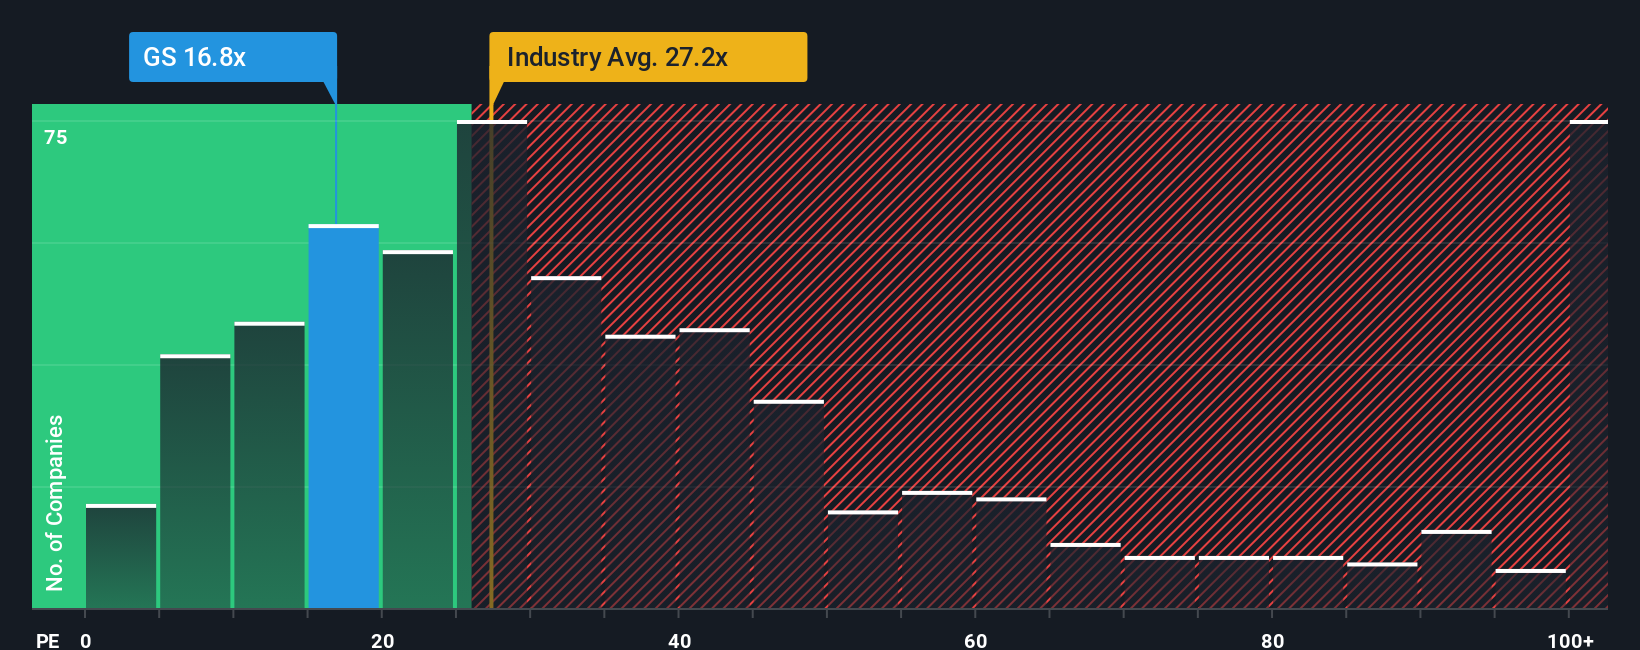
For a profitable company like Goldman Sachs Group, the P/E ratio is a useful shorthand for how much you are paying for each dollar of earnings. It links directly to what the business is currently earning, which many investors find easier to relate to than cash flow models.
What counts as a "normal" or "fair" P/E depends on how the market views a company’s growth prospects and risk. Higher expected growth or lower perceived risk can justify a higher multiple, while slower growth or higher risk usually calls for a lower one.
Goldman Sachs Group currently trades on a P/E of 18.70x. That sits below the Capital Markets industry average P/E of 25.77x and below the peer average of 31.19x. Simply Wall St’s Fair Ratio for Goldman Sachs Group is 19.86x. This Fair Ratio is a proprietary estimate of what the P/E might be given the company’s earnings growth profile, industry, profit margins, market cap and risk factors.
Compared with simple peer or industry comparisons, the Fair Ratio aims to be more tailored because it adjusts for those company specific characteristics. In this case, the actual P/E of 18.70x is below the Fair Ratio of 19.86x. On this metric, the shares appear modestly undervalued.
Result: UNDERVALUED
P/E ratios tell one story, but what if the real opportunity lies elsewhere? Discover 1443 companies where insiders are betting big on explosive growth.
Upgrade Your Decision Making: Choose your Goldman Sachs Group Narrative
Earlier we mentioned that there is an even better way to understand valuation. On Simply Wall St’s Community page you can use Narratives, where you tell the story you believe about Goldman Sachs Group, link that story to a forecast for revenue, earnings and margins, and then see the fair value that results. You can compare that fair value to the current price to judge whether the stock looks expensive or cheap to you, and watch your view update automatically when fresh news or earnings are released. One investor might build a Narrative that leans closer to the higher fair value around US$813 with stronger long term expectations, while a more cautious investor might anchor nearer the lower analyst price target around US$538, even though both are looking at the same company and the same data.
Do you think there's more to the story for Goldman Sachs Group? Head over to our Community to see what others are saying!
This article by Simply Wall St is general in nature. We provide commentary based on historical data and analyst forecasts only using an unbiased methodology and our articles are not intended to be financial advice. It does not constitute a recommendation to buy or sell any stock, and does not take account of your objectives, or your financial situation. We aim to bring you long-term focused analysis driven by fundamental data. Note that our analysis may not factor in the latest price-sensitive company announcements or qualitative material. Simply Wall St has no position in any stocks mentioned.
Have feedback on this article? Concerned about the content? Get in touch with us directly. Alternatively, email editorial-team@simplywallst.com