
- PREMIUM
- LIVE QUOTES
- INSTITUTIONS
 Index Options
 State Street
 CME Group
 Nasdaq
 Cboe
Cboe TradingView
 Wall Street Journal
Is EssilorLuxottica (ENXTPA:EL) Pricing Look Stretched After Recent Share Price Pullback
- If you are wondering whether EssilorLuxottica Société anonyme is fairly priced at around €272.50, you are not alone. The stock often attracts attention from investors trying to work out if the current tag matches the quality of the business.
- The share price has had a mixed run, with a 1.0% return over the last 7 days, a 10.1% decline over the past month, but positive returns of 2.6% year to date, 18.4% over 1 year, 66.0% over 3 years and 128.9% over 5 years.
- Recent coverage of EssilorLuxottica has focused on its position as a major global eyewear and lens group, and how that role fits into broader consumer and healthcare trends. This backdrop helps frame the recent share price moves as investors weigh long term brand strength against shorter term market swings.
- On our valuation checks, EssilorLuxottica currently scores 0 out of 6. Next we will look at what different valuation methods say about that price tag and then finish with a more holistic way to think about value that many investors overlook.
EssilorLuxottica Société anonyme scores just 0/6 on our valuation checks. See what other red flags we found in the full valuation breakdown.
Approach 1: EssilorLuxottica Société anonyme Discounted Cash Flow (DCF) Analysis
A Discounted Cash Flow model takes estimates of the cash a company might generate in the future and discounts those amounts back to today, to arrive at an estimate of what the business could be worth now.
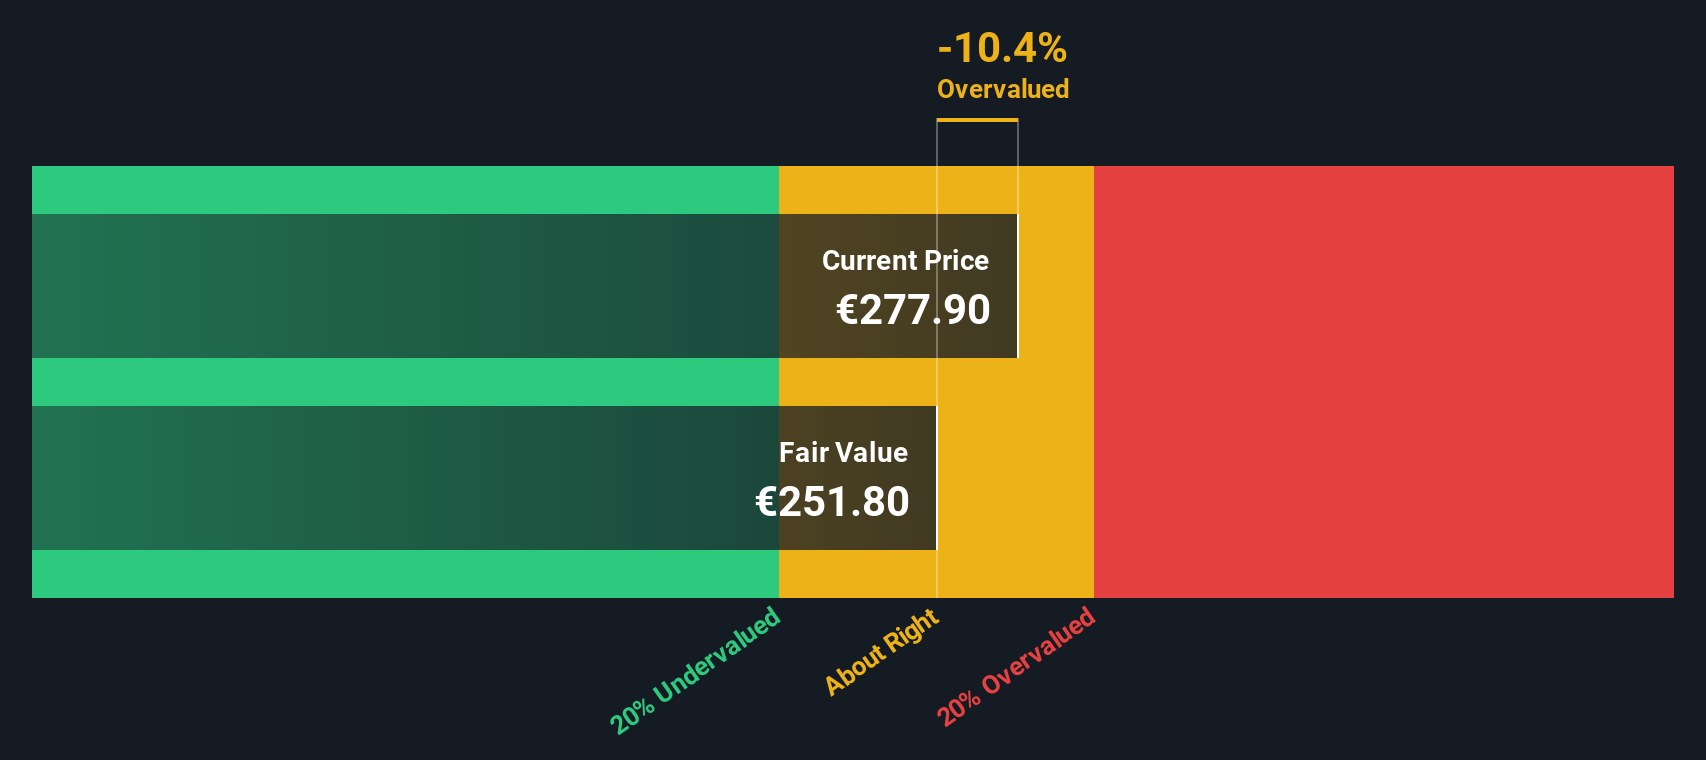
For EssilorLuxottica Société anonyme, the model used here is a 2 Stage Free Cash Flow to Equity approach. The latest twelve month free cash flow is about €3.3b. Analyst forecasts and extrapolations then project free cash flow out to 2035, with 2030 expected at €6.1b, based on a mix of analyst estimates for the earlier years and Simply Wall St extrapolations thereafter.
When all those projected cash flows are discounted back and summed, the model points to an estimated intrinsic value of about €251.32 per share, compared with the current share price of around €272.50. That suggests the shares are about 8.4% above this particular DCF estimate, so the result is not a huge gap but it leans to the expensive side.
Result: ABOUT RIGHT
EssilorLuxottica Société anonyme is fairly valued according to our Discounted Cash Flow (DCF), but this can change at a moment's notice. Track the value in your watchlist or portfolio and be alerted on when to act.
Approach 2: EssilorLuxottica Société anonyme Price vs Earnings
For a profitable business like EssilorLuxottica Société anonyme, the P/E ratio is a useful shorthand because it links what you pay for each share directly to the earnings that the company is currently generating.
What counts as a “normal” P/E depends a lot on how quickly earnings are expected to grow and how risky those earnings are. Higher expected growth or lower perceived risk can justify a higher P/E, while slower growth or higher risk tends to support a lower one.
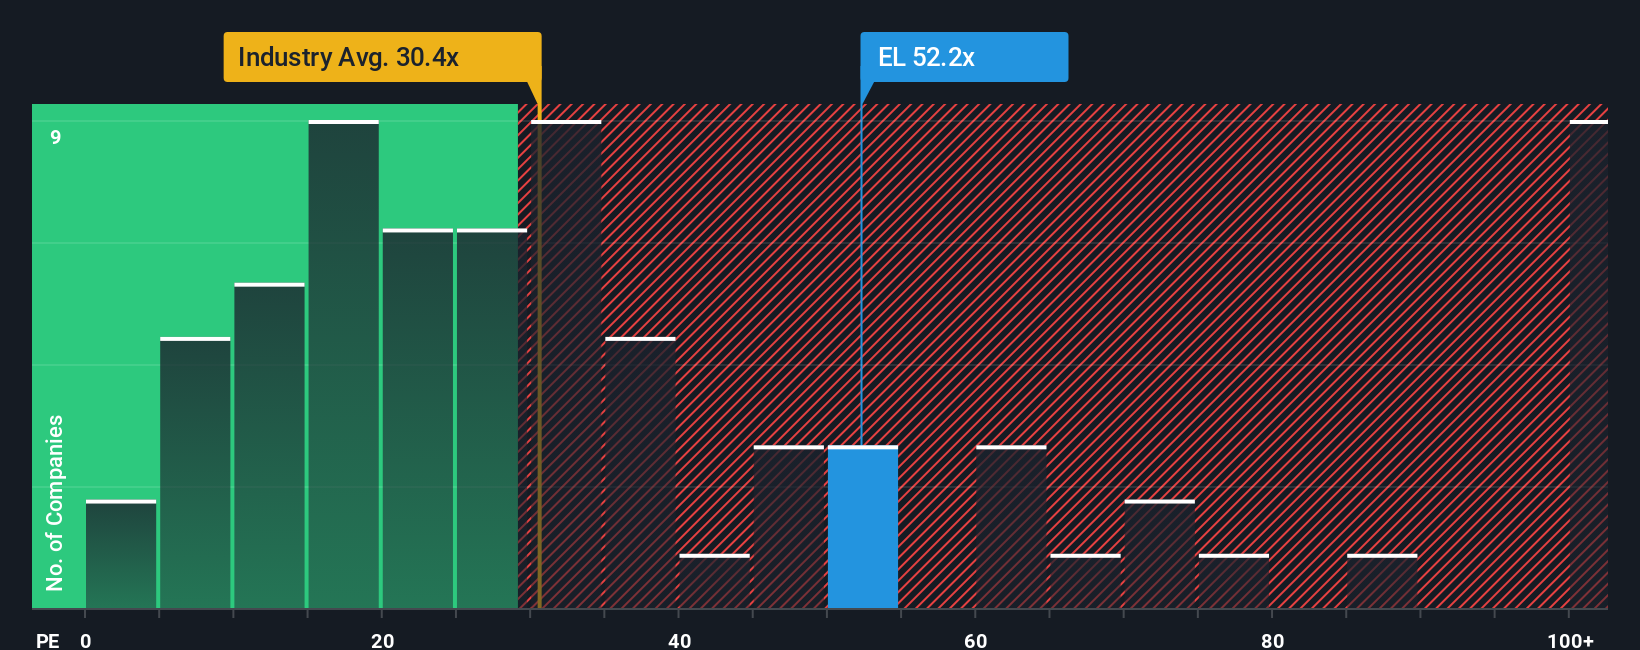
EssilorLuxottica currently trades on a P/E of about 52.78x. That sits above the Medical Equipment industry average of around 28.49x and also above the peer group average of roughly 31.56x. Simply Wall St’s Fair Ratio for the stock is 49.55x, which is its in house estimate of what a reasonable P/E might be given factors such as earnings growth, profit margins, industry, market value and identified risks.
This Fair Ratio can be more informative than a simple industry or peer comparison because it attempts to adjust for the company’s own profile rather than assuming all firms should trade on the same multiple. Compared with that 49.55x Fair Ratio, the current 52.78x P/E suggests that EssilorLuxottica appears somewhat expensive on this measure.
Result: OVERVALUED
P/E ratios tell one story, but what if the real opportunity lies elsewhere? Discover 1443 companies where insiders are betting big on explosive growth.
Upgrade Your Decision Making: Choose your EssilorLuxottica Société anonyme Narrative
Earlier we mentioned that there is an even better way to understand valuation, so let us introduce you to Narratives. These are simply your story about EssilorLuxottica Société anonyme linked to your own forecast for revenue, earnings and margins, and then to your view of fair value.
On Simply Wall St, Narratives on the Community page let you set your assumptions, see what fair value they imply, and then compare that to the current share price so you can decide for yourself whether the gap between value and price looks attractive or not.
Because Narratives update automatically when new information such as earnings releases or news arrives, you are not locked into a static model. You can quickly see how fresh data affects your view.
For EssilorLuxottica Société anonyme, one investor might build a Narrative that lines up with the higher analyst fair value of about €324.65 based on stronger expectations, while another might lean closer to the lower price target of €180.00. Seeing those different stories side by side can help you decide which assumptions you find more reasonable.
Do you think there's more to the story for EssilorLuxottica Société anonyme? Head over to our Community to see what others are saying!

This article by Simply Wall St is general in nature. We provide commentary based on historical data and analyst forecasts only using an unbiased methodology and our articles are not intended to be financial advice. It does not constitute a recommendation to buy or sell any stock, and does not take account of your objectives, or your financial situation. We aim to bring you long-term focused analysis driven by fundamental data. Note that our analysis may not factor in the latest price-sensitive company announcements or qualitative material. Simply Wall St has no position in any stocks mentioned.
Have feedback on this article? Concerned about the content? Get in touch with us directly. Alternatively, email editorial-team@simplywallst.com