
- PREMIUM
- LIVE QUOTES
- INSTITUTIONS
 Index Options
 State Street
 CME Group
 Nasdaq
 Cboe
Cboe TradingView
 Wall Street Journal
Has Lamb Weston (LW) Become More Attractive After A Sharp Share Price Pullback
- If you are wondering whether Lamb Weston Holdings is starting to look like value after a rough stretch, this breakdown will help you put the current share price into context.
- The stock last closed at US$40.29, with returns of a 3.8% decline over 7 days, 32.3% decline over 30 days, 4.7% decline year to date, 32.1% decline over 1 year, 56.2% decline over 3 years and 42.9% decline over 5 years.
- Recent coverage around Lamb Weston has focused on broader questions about frozen potato demand trends and how investors are thinking about consumer staples names more generally. These conversations help frame why the share price has moved and why some investors are rethinking the risk and reward trade off at current levels.
- On our checklist-based valuation framework, Lamb Weston scores 5 out of 6 for potential undervaluation, giving it a valuation score of 5. Next, we will compare what different valuation approaches say about the shares, then finish with a way to tie those numbers back to the bigger picture of the business.
Find out why Lamb Weston Holdings's -32.1% return over the last year is lagging behind its peers.
Approach 1: Lamb Weston Holdings Discounted Cash Flow (DCF) Analysis
A Discounted Cash Flow (DCF) model takes projected future cash flows, then discounts them back to today to estimate what the business might be worth right now. It is essentially asking what future cash that Lamb Weston Holdings could produce is worth in today’s dollars.
For Lamb Weston, the latest twelve month Free Cash Flow is about $244.9 million. Analysts have provided explicit Free Cash Flow estimates out to 2030, with projections such as $385.75 million in 2026 and $939 million in 2030. Beyond the analyst horizon, Simply Wall St extends the series using its own assumptions to complete a 2 Stage Free Cash Flow to Equity model, with each future year discounted back to today.
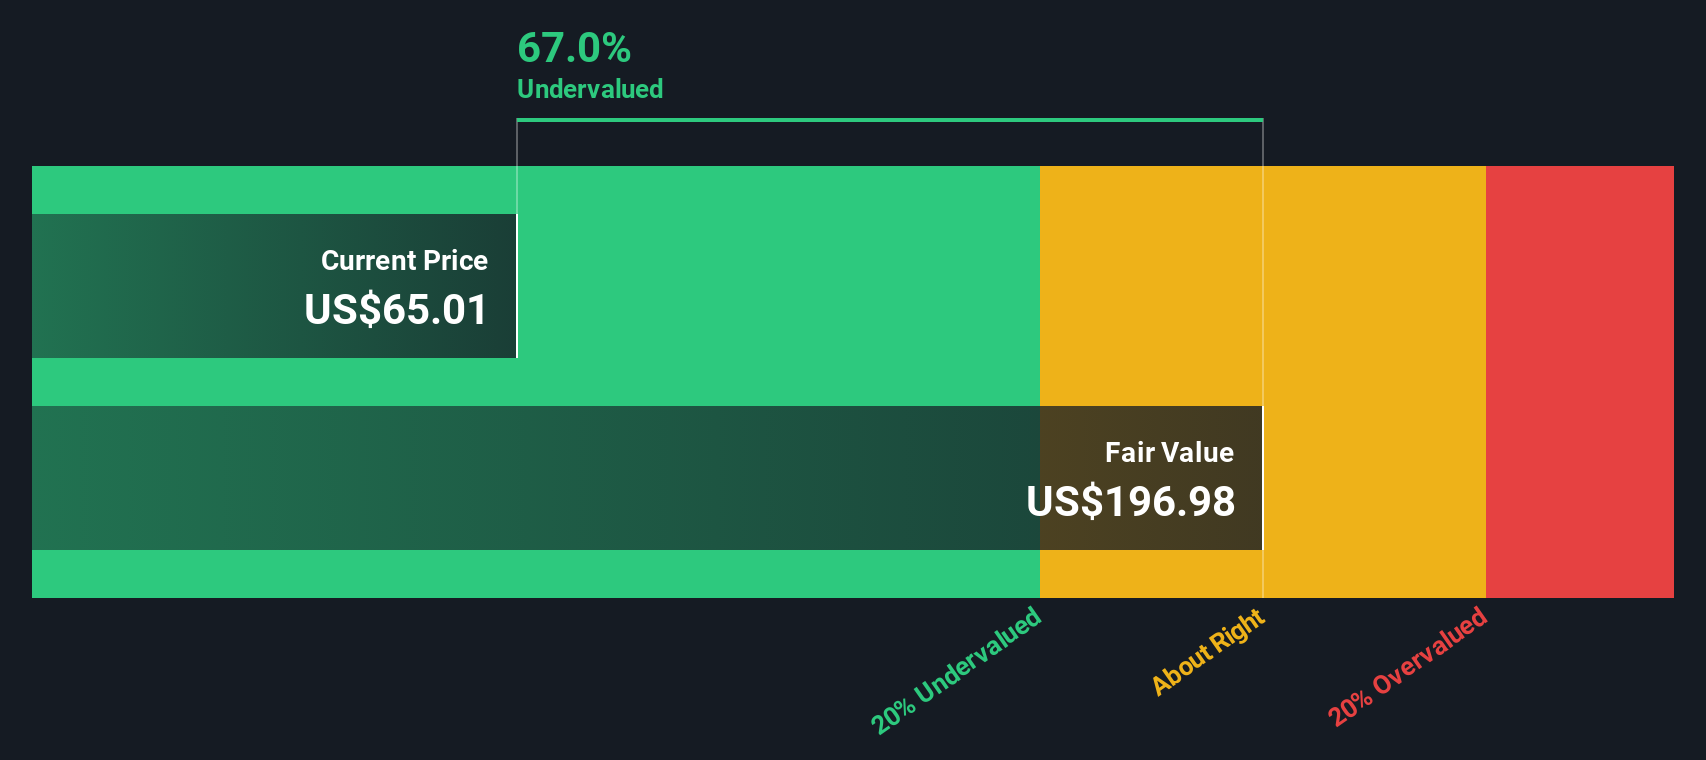
Adding those discounted cash flows together gives an estimated intrinsic value of about $206.61 per share. Compared with the recent share price of $40.29, the DCF output suggests an implied discount of about 80.5%, which indicates the shares screen as significantly undervalued on this model alone.
Result: UNDERVALUED
Our Discounted Cash Flow (DCF) analysis suggests Lamb Weston Holdings is undervalued by 80.5%. Track this in your watchlist or portfolio, or discover 884 more undervalued stocks based on cash flows.
Approach 2: Lamb Weston Holdings Price vs Earnings
For a profitable company like Lamb Weston, the P/E ratio is a useful shorthand because it links what you pay for the stock to the earnings the business is currently generating. It also gives you a quick way to compare how the market is pricing those earnings relative to other companies.
What counts as a “normal” P/E depends a lot on what investors expect for future earnings growth and how risky those earnings appear. Higher expected growth or lower perceived risk can justify a higher P/E, while lower growth expectations or higher risk usually align with a lower multiple.
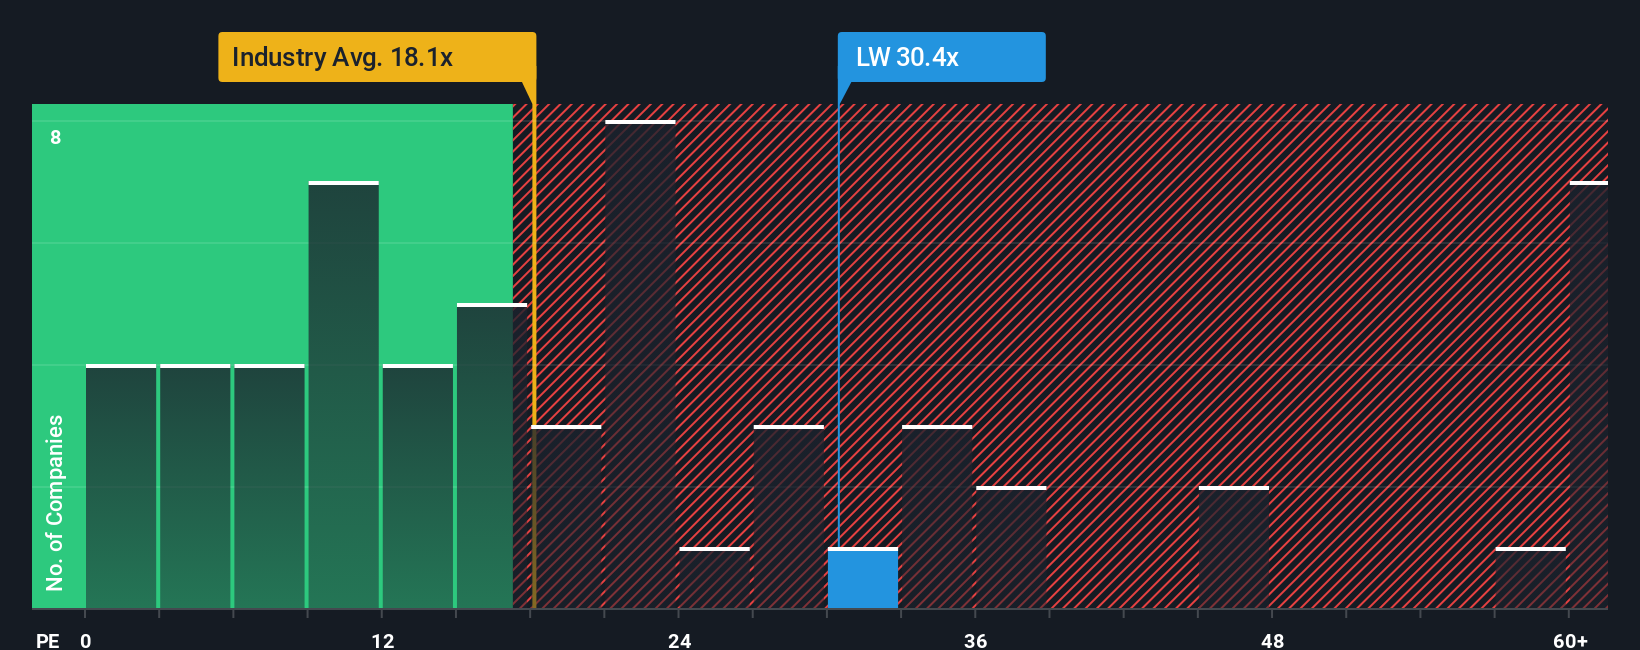
Lamb Weston currently trades on a P/E of 14.26x. That sits slightly below the peer average of 14.53x and below the Food industry average of 19.89x. Simply Wall St also provides a “Fair Ratio” of 20.75x, which is its proprietary estimate of what Lamb Weston’s P/E might be given factors like earnings growth, profit margins, industry, market cap and company specific risks. This Fair Ratio can be more tailored than a simple peer or industry comparison because it attempts to adjust for those fundamentals rather than relying on broad group averages alone. Comparing 20.75x to the current 14.26x suggests the shares may appear undervalued on this metric.
Result: UNDERVALUED
P/E ratios tell one story, but what if the real opportunity lies elsewhere? Discover 1443 companies where insiders are betting big on explosive growth.
Upgrade Your Decision Making: Choose your Lamb Weston Holdings Narrative
Earlier we mentioned that there is an even better way to understand valuation. Let us introduce you to Narratives, which are simple stories you build around Lamb Weston Holdings that connect your view of its future revenue, earnings and margins to a financial forecast, a Fair Value, and a clear comparison with today’s price. All of this is within an easy tool on Simply Wall St’s Community page that updates when new news or earnings arrive. One investor might lean toward a higher Fair Value around US$80 if they think the new Argentina facility, cost savings and volume growth will support stronger long term outcomes. Another might sit closer to US$57 if they are more cautious about restaurant traffic, pricing pressure and changing consumer preferences. Narratives help you see where your own view fits between those two and what that means for your next decision.
Do you think there's more to the story for Lamb Weston Holdings? Head over to our Community to see what others are saying!

This article by Simply Wall St is general in nature. We provide commentary based on historical data and analyst forecasts only using an unbiased methodology and our articles are not intended to be financial advice. It does not constitute a recommendation to buy or sell any stock, and does not take account of your objectives, or your financial situation. We aim to bring you long-term focused analysis driven by fundamental data. Note that our analysis may not factor in the latest price-sensitive company announcements or qualitative material. Simply Wall St has no position in any stocks mentioned.
Have feedback on this article? Concerned about the content? Get in touch with us directly. Alternatively, email editorial-team@simplywallst.com