
- PREMIUM
- LIVE QUOTES
- INSTITUTIONS
 Index Options
 State Street
 CME Group
 Nasdaq
 Cboe
Cboe TradingView
 Wall Street Journal
Is Eli Lilly (LLY) Still Sensibly Priced After GLP 1 Weight Loss Breakthrough Hype
- If you are wondering whether Eli Lilly's share price still makes sense at around US$1,108, you are not alone. Many investors are asking what they are really paying for at this level.
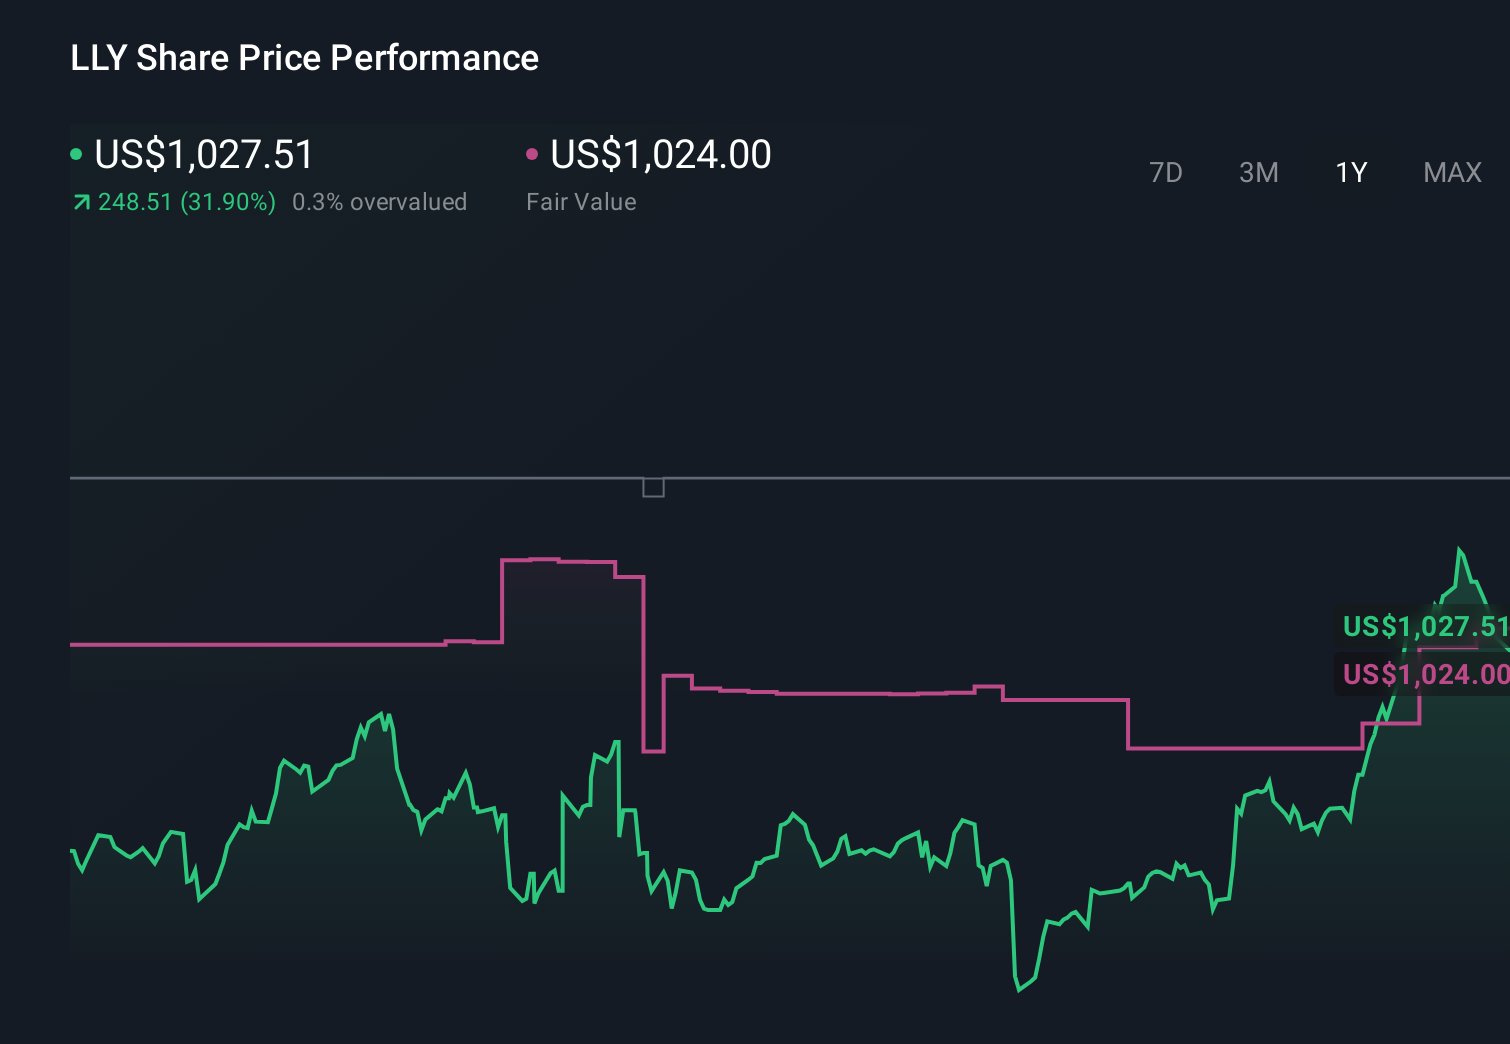
- The stock has recently posted returns of 3.1% over the last 7 days, 11.1% over the last 30 days, 2.6% year to date, 41.8% over the last year and a very large gain over 5 years, which naturally raises questions about growth potential and changes in perceived risk.
- Recent headlines have focused on Eli Lilly's weight loss and diabetes treatments, which have been a key talking point for the company and the sector. Media coverage has often linked these products to investor interest, helping frame how the market is thinking about the current share price.
- Our valuation work gives Eli Lilly a valuation score of 1 out of 6. Next we will walk through the main valuation approaches investors commonly use and then finish with a different way of thinking about what the stock could be worth.
Eli Lilly scores just 1/6 on our valuation checks. See what other red flags we found in the full valuation breakdown.
Approach 1: Eli Lilly Discounted Cash Flow (DCF) Analysis
A Discounted Cash Flow, or DCF, model estimates what a company could be worth by projecting its future cash flows and then discounting those back to today using a required rate of return. It is essentially asking what those future dollars are worth in current terms.
For Eli Lilly, the model used is a 2 Stage Free Cash Flow to Equity approach. The latest twelve month Free Cash Flow is about $6.2b. Analysts supply detailed Free Cash Flow estimates for several years, and Simply Wall St then extrapolates further to build a 10 year path, reaching a projected Free Cash Flow of $59.2b in 2035. These projections, all in $, are then discounted to arrive at a single estimate of value per share.
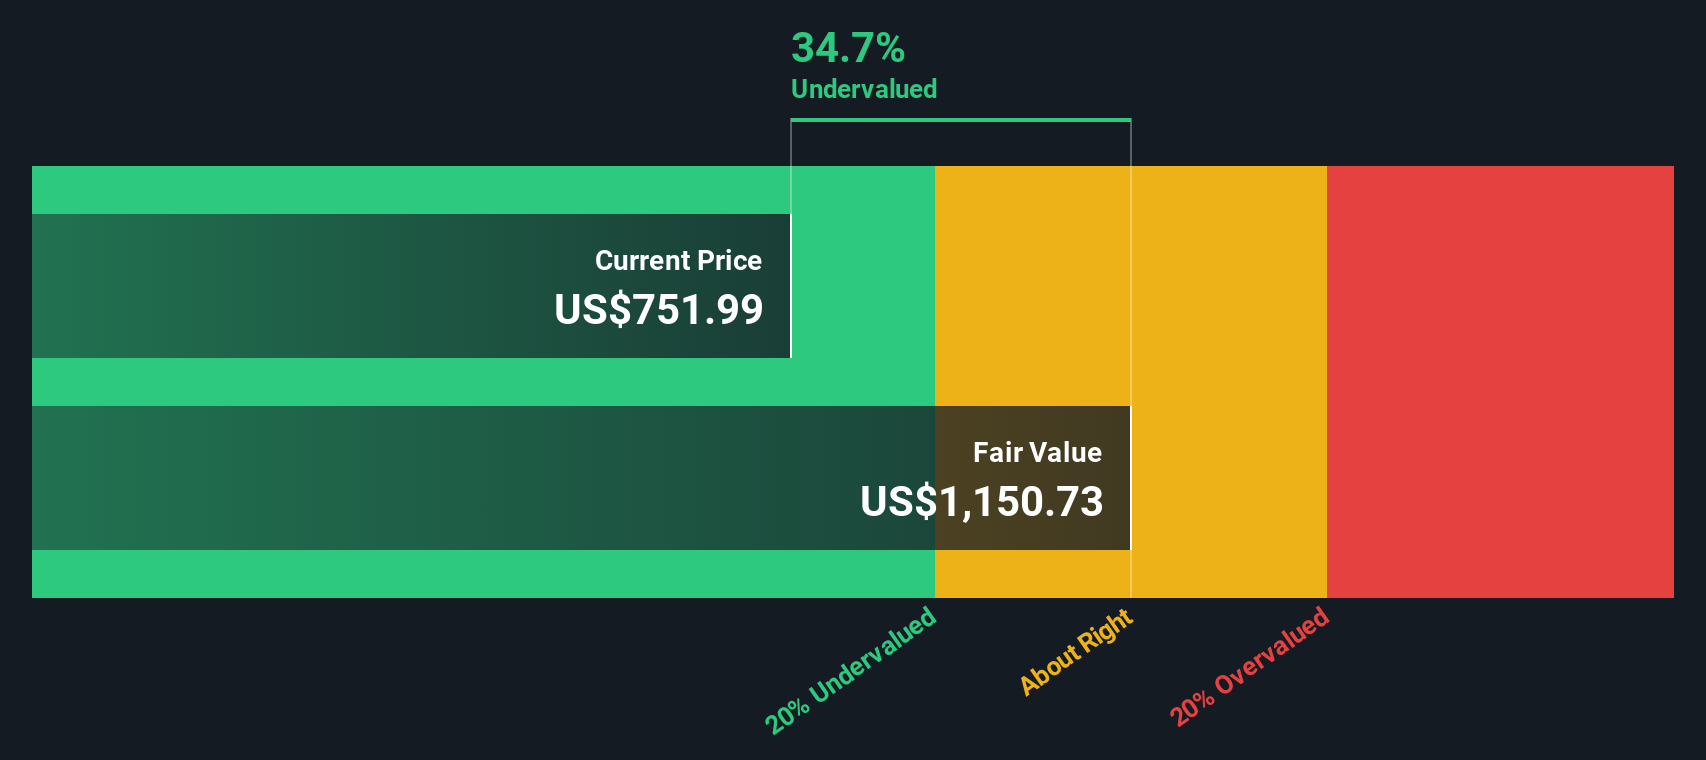
On this basis, Eli Lilly’s DCF fair value is calculated at US$1,253.18 per share, compared with a current share price of about US$1,108. That implies an intrinsic discount of roughly 11.6%, which indicates that the shares are trading below this cash flow based estimate of value.
Result: UNDERVALUED
Our Discounted Cash Flow (DCF) analysis suggests Eli Lilly is undervalued by 11.6%. Track this in your watchlist or portfolio, or discover 886 more undervalued stocks based on cash flows.
Approach 2: Eli Lilly Price vs Earnings
For profitable companies like Eli Lilly, the P/E ratio is a straightforward way to think about what you are paying for each dollar of earnings. It links directly to the bottom line, which is usually what ultimately matters to shareholders.
What counts as a “normal” or “fair” P/E depends on how the market views a company’s growth prospects and risk profile. Higher expected growth or lower perceived risk can justify a higher P/E, while slower growth or higher risk tends to go with a lower P/E.
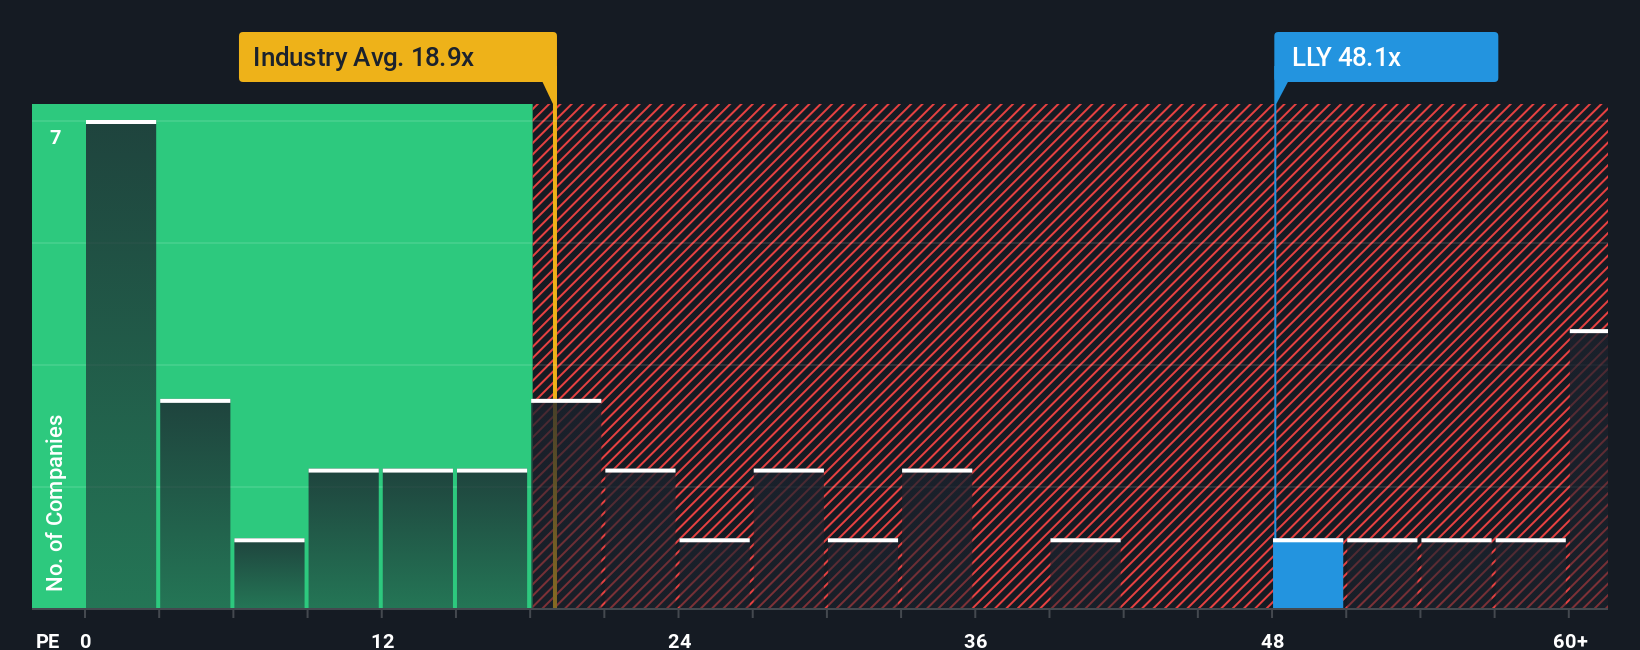
Eli Lilly currently trades on about 53.89x earnings, compared with the Pharmaceuticals industry average of about 19.90x and a peer group average of about 16.96x. Simply Wall St’s Fair Ratio for Eli Lilly is 42.45x. This Fair Ratio is a proprietary estimate of what the P/E might be, given factors such as earnings growth, profit margins, industry, market cap and identified risks.
Because the Fair Ratio incorporates those company specific drivers, it can be more tailored than a simple comparison with peers or the broad industry. With the current P/E of 53.89x sitting above the Fair Ratio of 42.45x, the shares screen as expensive on this metric.
Result: OVERVALUED
P/E ratios tell one story, but what if the real opportunity lies elsewhere? Discover 1443 companies where insiders are betting big on explosive growth.
Upgrade Your Decision Making: Choose your Eli Lilly Narrative
Earlier we mentioned that there is an even better way to think about valuation. On Simply Wall St that starts with Narratives, which are your own story for Eli Lilly that links what you believe about its GLP 1 opportunity, risks and margins to a forecast for revenue, earnings and cash flows, and then to a fair value you can compare with today’s price.
On the Community page, millions of investors use Narratives as an easy tool to set their assumptions and see a live fair value that updates when new earnings, news or regulatory developments come through. This means you can always see how fresh information might affect your view.
For Eli Lilly right now, one Narrative on the platform uses a fair value of about US$1,189 per share, while another uses about US$1,093. This shows how two investors can look at the same company and reach different, but clearly explained, conclusions based on their own expectations and discount rates.
For Eli Lilly however we'll make it really easy for you with previews of two leading Eli Lilly Narratives:
Each one ties the same core facts about GLP 1 demand, pricing, and policy into a different conclusion about what the current US$1,108.09 share price could mean for you.
Fair value used in this Narrative: about US$1,189.18 per share
Implied discount to this fair value: about 6.8% below the Narrative value
Revenue growth assumption: 20%
- Tirzepatide drugs Mounjaro and Zepbound are treated as the core engine for earnings, with numbers cited for 2024 to 2026 sales expectations and a focus on capacity expansion to meet demand.
- The author highlights long patent protection, low GLP 1 penetration in a 100m to 120m U.S. addressable market and gradually improving insurance coverage as key supports for the story.
- Risks flagged include high monthly pricing, new entrants, potential side effects and lawsuits, and a high current P/E, but the Narrative still arrives at a fair value around US$1,200 based on 20% to 25% revenue growth over 3 to 5 years and a 9% discount rate.
Fair value used in this Narrative: about US$1,093.22 per share
Implied premium to this fair value: about 1.4% above the Narrative value
Revenue growth assumption: 18.12%
- This Narrative leans on analyst assumptions that revenue grows at about 18.7% a year over 3 years, profit margins widen from 25.9% to 38.4% and earnings reach US$34.2b by around September 2028, but questions whether the P/E can stay at a premium level.
- It stresses concentration in a handful of GLP 1 products, exposure to drug price controls and reimbursement decisions, and competition from generics, compounders and other large pharma as possible sources of pressure on margins and volumes.
- With a consensus price target of US$891.62 based on those earnings, margin and discount rate assumptions, it concludes that investors need to be comfortable with policy risk, execution risk on manufacturing scale up and litigation overhangs to justify paying close to or above US$1,100.
If you feel one of these fits how you think Eli Lilly’s story plays out, you can use it as a starting point to build or adjust your own assumptions, rather than relying only on a single fair value number.
Curious how numbers become stories that shape markets? Explore Community Narratives
Do you think there's more to the story for Eli Lilly? Head over to our Community to see what others are saying!
This article by Simply Wall St is general in nature. We provide commentary based on historical data and analyst forecasts only using an unbiased methodology and our articles are not intended to be financial advice. It does not constitute a recommendation to buy or sell any stock, and does not take account of your objectives, or your financial situation. We aim to bring you long-term focused analysis driven by fundamental data. Note that our analysis may not factor in the latest price-sensitive company announcements or qualitative material. Simply Wall St has no position in any stocks mentioned.
Have feedback on this article? Concerned about the content? Get in touch with us directly. Alternatively, email editorial-team@simplywallst.com