
Is There Now An Opportunity In Carrier Global (CARR) After A 22% One Year Decline
- If you are wondering whether Carrier Global's current share price reflects its underlying value, you are not alone. This article is designed to help you assess that.
- The stock closed at US$52.57 recently, with returns of a 0.5% decline over 7 days, a 0.9% decline over 30 days, a 1.8% decline year to date and a 22.4% decline over 1 year, set against longer term returns of 20.8% over 3 years and 35.5% over 5 years.
- Those mixed returns have put more attention on how Carrier Global is being priced and what might be driving sentiment. Recent coverage has focused on how investors are reassessing capital goods companies and what that could mean for businesses like Carrier Global in areas such as building systems and climate solutions.
- Simply Wall St currently gives Carrier Global a valuation score of 4 out of 6. This suggests there is more to unpack in the way it screens on different checks. We will compare several valuation approaches before finishing with a framework that can help you think about value in a more complete way.
Find out why Carrier Global's -22.4% return over the last year is lagging behind its peers.
Approach 1: Carrier Global Discounted Cash Flow (DCF) Analysis
A Discounted Cash Flow, or DCF, model looks at the cash Carrier Global is expected to generate in the future, then discounts those cash flows back into today’s dollars to estimate what the business might be worth now.
For Carrier Global, the latest twelve month Free Cash Flow is about US$1.13b. Using a 2 Stage Free Cash Flow to Equity model that projects cash flows out over the coming years, analysts and extrapolated estimates point to Free Cash Flow of US$3.09b by 2028, with further projections running out to 2035 based on a mix of analyst inputs and Simply Wall St estimates.
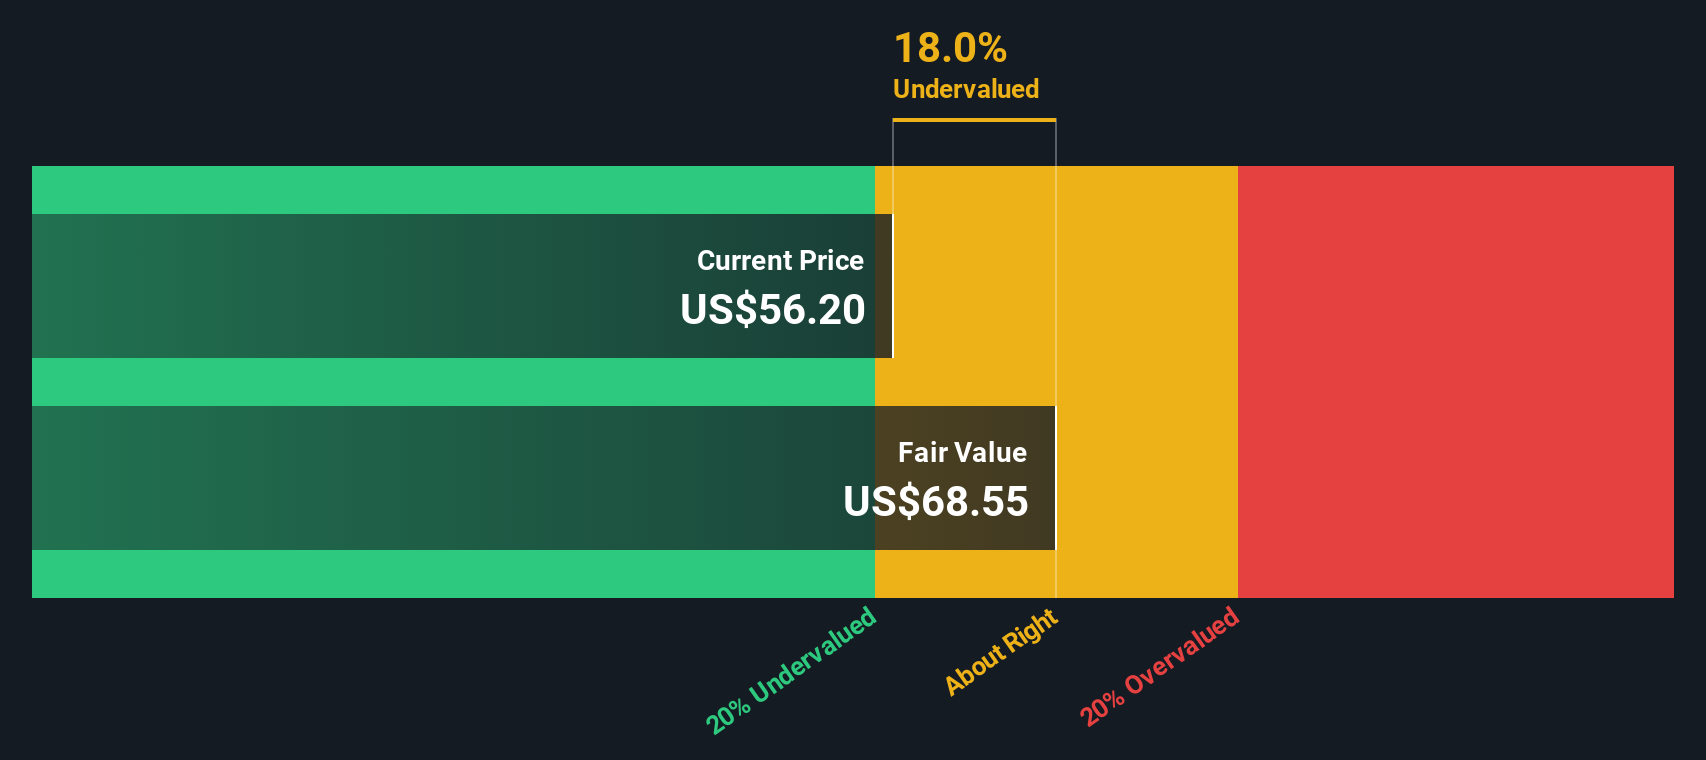
When all those projected cash flows are discounted back to today using the DCF model, Simply Wall St arrives at an estimated intrinsic value of US$67.78 per share. Against the recent share price of US$52.57, this implies that Carrier Global trades at a 22.4% discount to that DCF estimate, which indicates the stock screens as undervalued on this model.
Result: UNDERVALUED
Our Discounted Cash Flow (DCF) analysis suggests Carrier Global is undervalued by 22.4%. Track this in your watchlist or portfolio, or discover 886 more undervalued stocks based on cash flows.
Approach 2: Carrier Global Price vs Earnings
For a profitable company like Carrier Global, the P/E ratio is a useful shorthand for what the market is currently willing to pay for each dollar of earnings. It captures both what investors think about the business today and how they weigh its future prospects and risks.
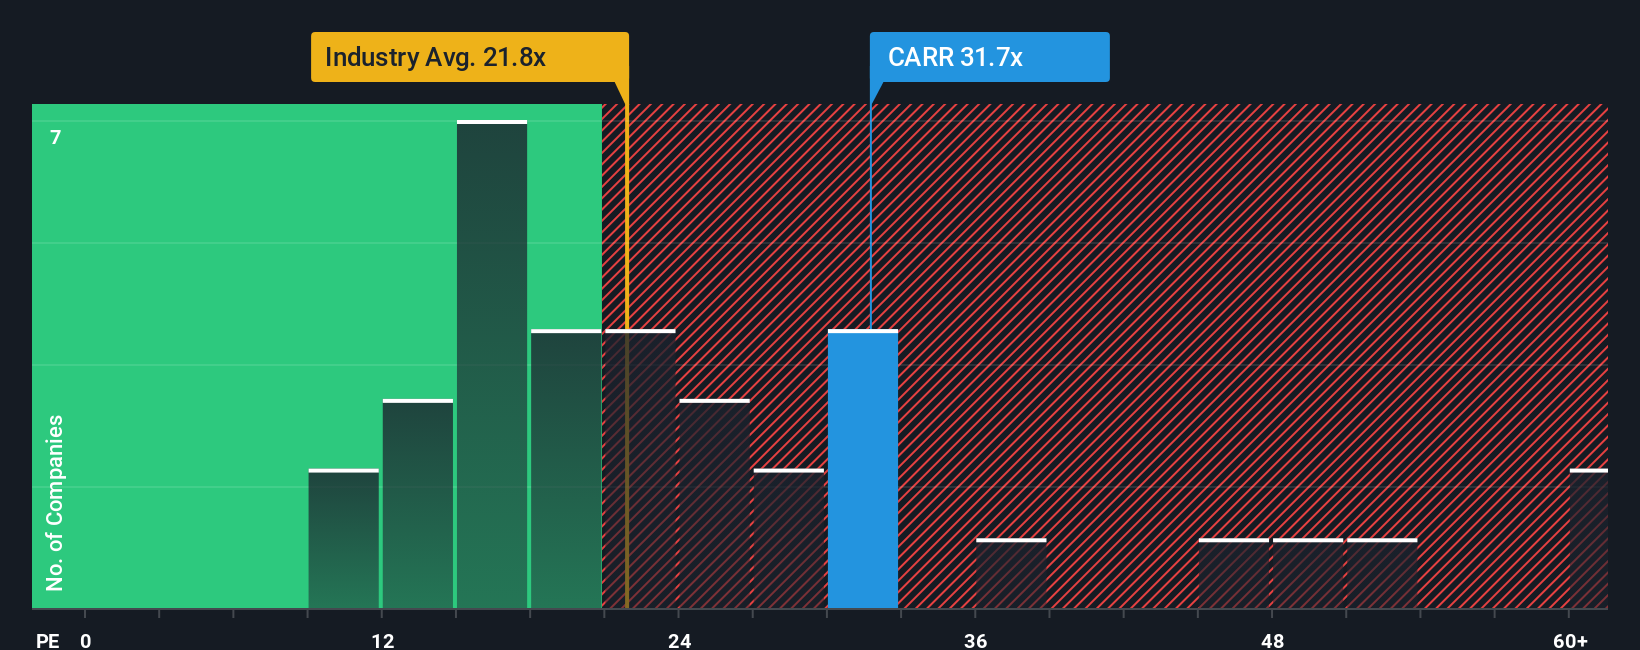
In general, higher expected earnings growth and lower perceived risk can support a higher P/E, while lower growth and higher risk tend to align with a lower, more conservative P/E. Carrier Global currently trades on a P/E of 32.11x, compared with the Building industry average of about 19.79x and a peer group average of 27.66x. On those simple comparisons, the stock is priced at a higher multiple than both its industry and peers.
Simply Wall St also calculates a proprietary “Fair Ratio” to give a more tailored view. This Fair Ratio, 37.20x for Carrier Global, is the P/E level suggested after considering factors such as earnings growth, profit margins, industry, market cap and specific risks. Because it adjusts for these company level drivers, it can be more informative than a basic industry or peer comparison. With the current P/E of 32.11x sitting below the 37.20x Fair Ratio, the stock is described as undervalued on this multiple based approach.
Result: UNDERVALUED
P/E ratios tell one story, but what if the real opportunity lies elsewhere? Discover 1443 companies where insiders are betting big on explosive growth.
Upgrade Your Decision Making: Choose your Carrier Global Narrative
Earlier we mentioned that there is an even better way to understand valuation, so let us introduce you to Narratives, a simple way for you to write the story you see for Carrier Global, link that story to your own forecasts for revenue, earnings and margins, and arrive at a personal fair value that you can compare with the current price using an easy tool on Simply Wall St’s Community page. Narratives are refreshed when new information such as news or earnings is released. One investor might build a Carrier Global Narrative that leans on the higher analyst price target of US$100.00 with stronger assumptions around commercial HVAC and data center demand. Another investor might anchor closer to the lower target of US$65.00 with more cautious views on tariffs, regional softness and margins. The platform helps you line up those different stories against today’s price to decide what action, if any, makes sense for you.
Do you think there's more to the story for Carrier Global? Head over to our Community to see what others are saying!

This article by Simply Wall St is general in nature. We provide commentary based on historical data and analyst forecasts only using an unbiased methodology and our articles are not intended to be financial advice. It does not constitute a recommendation to buy or sell any stock, and does not take account of your objectives, or your financial situation. We aim to bring you long-term focused analysis driven by fundamental data. Note that our analysis may not factor in the latest price-sensitive company announcements or qualitative material. Simply Wall St has no position in any stocks mentioned.
Have feedback on this article? Concerned about the content? Get in touch with us directly. Alternatively, email editorial-team@simplywallst.com