
- PREMIUM
- LIVE QUOTES
- INSTITUTIONS
 Index Options
 State Street
 CME Group
 Nasdaq
 Cboe
Cboe TradingView
 Wall Street Journal
Is It Too Late To Consider Qnity Electronics (Q) After Its Recent Share Price Jump?
- If you are wondering whether Qnity Electronics at about US$90.31 is a fair deal or a stretched price, this article walks through what the numbers are actually saying about its value.
- The stock has recently moved, with returns of 10.6% over the past week, 7.1% over the last 30 days and 6.3% year to date. This naturally raises questions about how much of the valuation story is already reflected in the share price.
- Recent coverage around Qnity Electronics has focused on its position within the semiconductor space and how investors are reassessing companies in this area in light of sector attention and shifting expectations. This context helps explain why the recent share price moves have drawn interest from both existing shareholders and those watching from the sidelines.
- Right now, Qnity Electronics scores 2 out of 6 on our valuation checks. This means it screens as undervalued on two of the methods we use. Next we will walk through those approaches and then finish with a broader way to think about what value really means for this stock.
Qnity Electronics scores just 2/6 on our valuation checks. See what other red flags we found in the full valuation breakdown.
Approach 1: Qnity Electronics Discounted Cash Flow (DCF) Analysis
A Discounted Cash Flow, or DCF, model looks at the cash Qnity Electronics is expected to generate in the future and then discounts those cash flows back into today’s dollars, using a required rate of return. The result is an estimate of what the business might be worth on a per share basis right now.
For Qnity Electronics, the model used is a 2 Stage Free Cash Flow to Equity approach. The latest twelve month free cash flow is about $815.43 million. Analysts provide explicit free cash flow estimates out to 2028, with Simply Wall St extrapolating further out to 2035. Within these projections, free cash flow in 2026, 2027 and 2028 is modeled at $618.50 million, $707.50 million and $849 million respectively. It continues to be projected in millions of dollars through 2035.
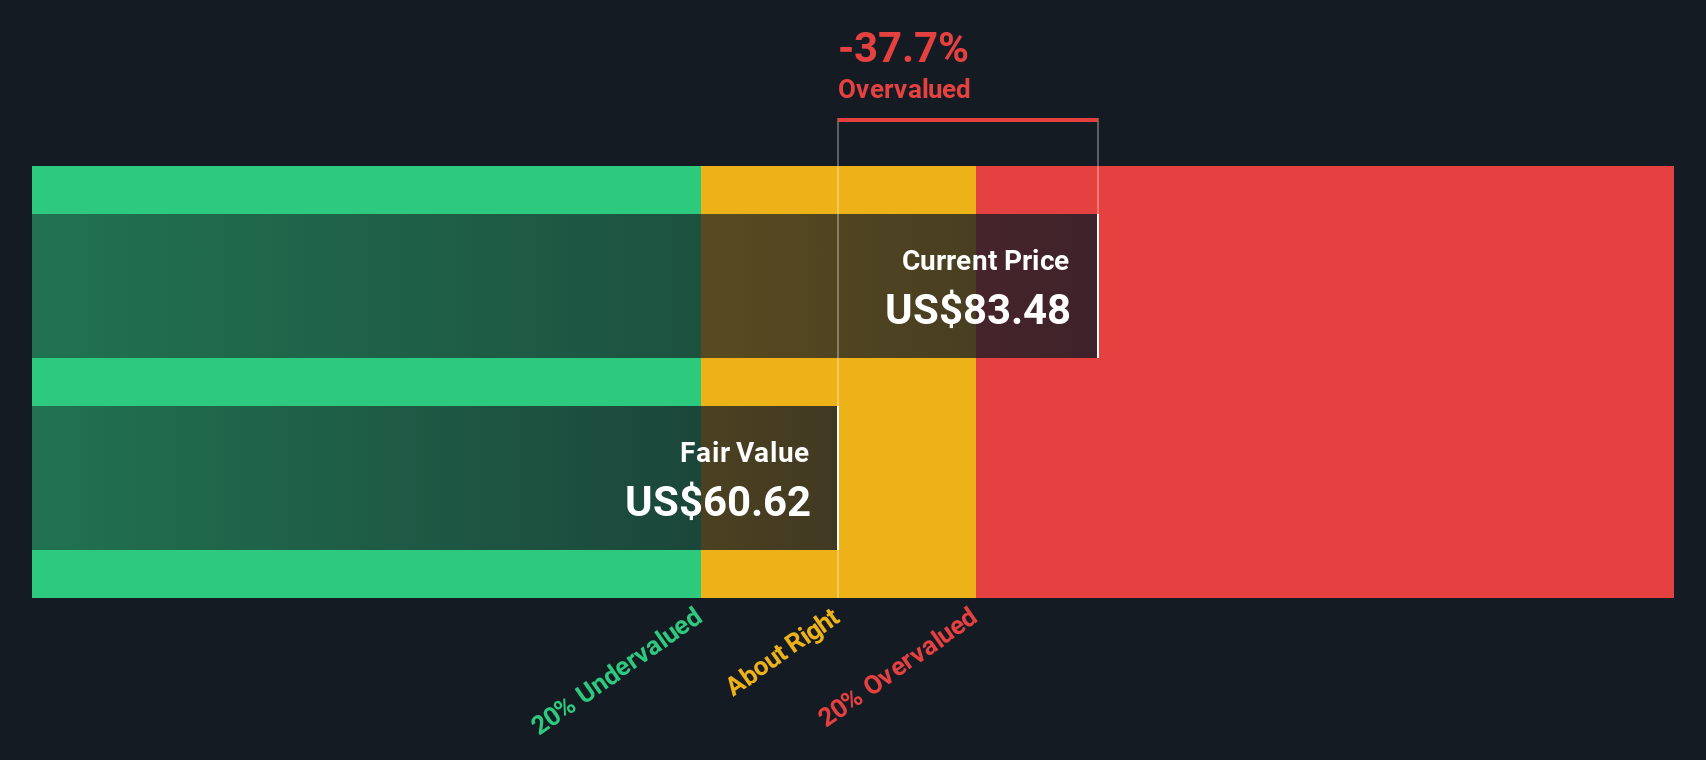
When all those projected cash flows are discounted back, the DCF model suggests an intrinsic value of about $58.52 per share, compared with the current share price of roughly $90.31. That gap equates to the shares screening as around 54.3% overvalued under this framework.
Result: OVERVALUED
Our Discounted Cash Flow (DCF) analysis suggests Qnity Electronics may be overvalued by 54.3%. Discover 886 undervalued stocks or create your own screener to find better value opportunities.
Approach 2: Qnity Electronics Price vs Earnings
For profitable companies, the P/E ratio is often a useful shortcut because it links what you pay for each share directly to the earnings that each share currently generates. It helps you quickly gauge how much the market is willing to pay today for a dollar of profit.
What counts as a “normal” P/E depends on what investors expect from a company, as well as how risky they think those earnings are. Higher expected growth or lower perceived risk can justify a higher P/E, while slower expected growth or higher risk usually calls for a lower one.
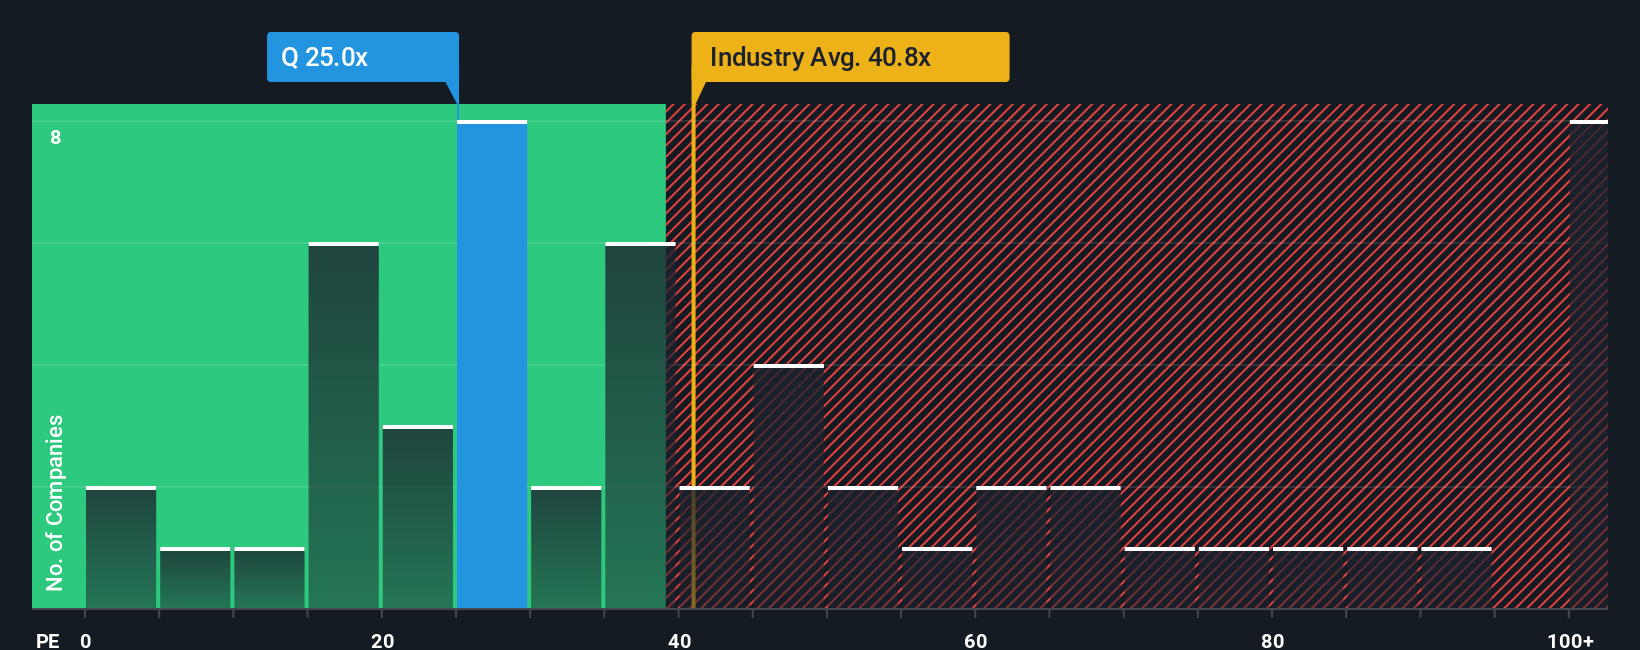
Qnity Electronics currently trades on a P/E of about 23.50x. That sits below the Semiconductor industry average P/E of roughly 42.34x and also below the peer group average of about 54.13x. Simply Wall St also uses a proprietary “Fair Ratio” for P/E, which is the multiple you might expect based on factors such as earnings growth, industry, profit margin, market cap and key risks. This tailored Fair Ratio can be more informative than a simple comparison with peers or the industry because it adjusts for the company’s own profile rather than assuming all semiconductor stocks should trade at the same level.
Result: ABOUT RIGHT
P/E ratios tell one story, but what if the real opportunity lies elsewhere? Discover 1443 companies where insiders are betting big on explosive growth.
Upgrade Your Decision Making: Choose your Qnity Electronics Narrative
Earlier we mentioned that there is an even better way to understand valuation, so let us introduce you to Narratives, which are simple stories you create about Qnity Electronics that link your view of its future revenue, earnings and margins to a financial forecast and then to your own fair value estimate.
On Simply Wall St’s Community page, used by millions of investors, Narratives give you an easy tool to set these assumptions, see what fair value they imply and then compare that fair value to the current share price. This can help you decide whether Qnity Electronics looks attractive, fully priced or expensive on your numbers.
Because Narratives are updated when new information such as news, earnings or guidance is added to the platform, your fair value view can adjust quickly rather than staying frozen in an old model.
For example, one Qnity Electronics Narrative might assume relatively cautious revenue growth and a modest profit margin, leading to a fair value well below US$90.31. Another might assume stronger growth and higher margins, which would support a fair value closer to or above today’s price.
Do you think there's more to the story for Qnity Electronics? Head over to our Community to see what others are saying!

This article by Simply Wall St is general in nature. We provide commentary based on historical data and analyst forecasts only using an unbiased methodology and our articles are not intended to be financial advice. It does not constitute a recommendation to buy or sell any stock, and does not take account of your objectives, or your financial situation. We aim to bring you long-term focused analysis driven by fundamental data. Note that our analysis may not factor in the latest price-sensitive company announcements or qualitative material. Simply Wall St has no position in any stocks mentioned.
Have feedback on this article? Concerned about the content? Get in touch with us directly. Alternatively, email editorial-team@simplywallst.com