
- PREMIUM
- LIVE QUOTES
- INSTITUTIONS
 Index Options
 State Street
 CME Group
 Nasdaq
 Cboe
Cboe TradingView
 Wall Street Journal
Is Xencor (XNCR) Now Fairly Priced After Prolonged Share Price Declines
- If you are wondering whether Xencor's current share price gives you fair value or a potential discount, this article will walk through what the numbers actually say.
- The stock recently closed at US$14.95, with returns of a 2.4% decline over 7 days, a 15.4% decline over 30 days, a 0.2% gain year to date, and a 36.2% decline over 1 year. The 3 year and 5 year returns stand at 45.1% and 68.8% declines respectively.
- Recent attention on Xencor has centred on its position within the pharmaceuticals and biotech space and how investors are weighing its pipeline potential against execution risks. This context is important when thinking about whether the recent share price moves are more about changing sentiment or about shifting expectations for the business.
- Right now, Xencor has a valuation score of 3 out of 6. This means it screens as undervalued on half of the checks we run. We will look at what that actually means using several valuation approaches, before finishing with a broader way to think about value that many investors overlook.
Find out why Xencor's -36.2% return over the last year is lagging behind its peers.
Approach 1: Xencor Discounted Cash Flow (DCF) Analysis
A Discounted Cash Flow model estimates what a company could be worth by projecting its future cash flows and then discounting those back to today using a required rate of return. It is essentially asking what all those future dollars are worth in present terms.
For Xencor, the model uses a 2 Stage Free Cash Flow to Equity approach based on cash flow projections. The latest twelve month free cash flow stands at a loss of $149.47 million. Analysts provide explicit free cash flow estimates out to 2030, with Simply Wall St extrapolating further years. Within this, free cash flow is projected to move from losses in the next few years to a positive $34.15 million in 2030, all expressed in $.
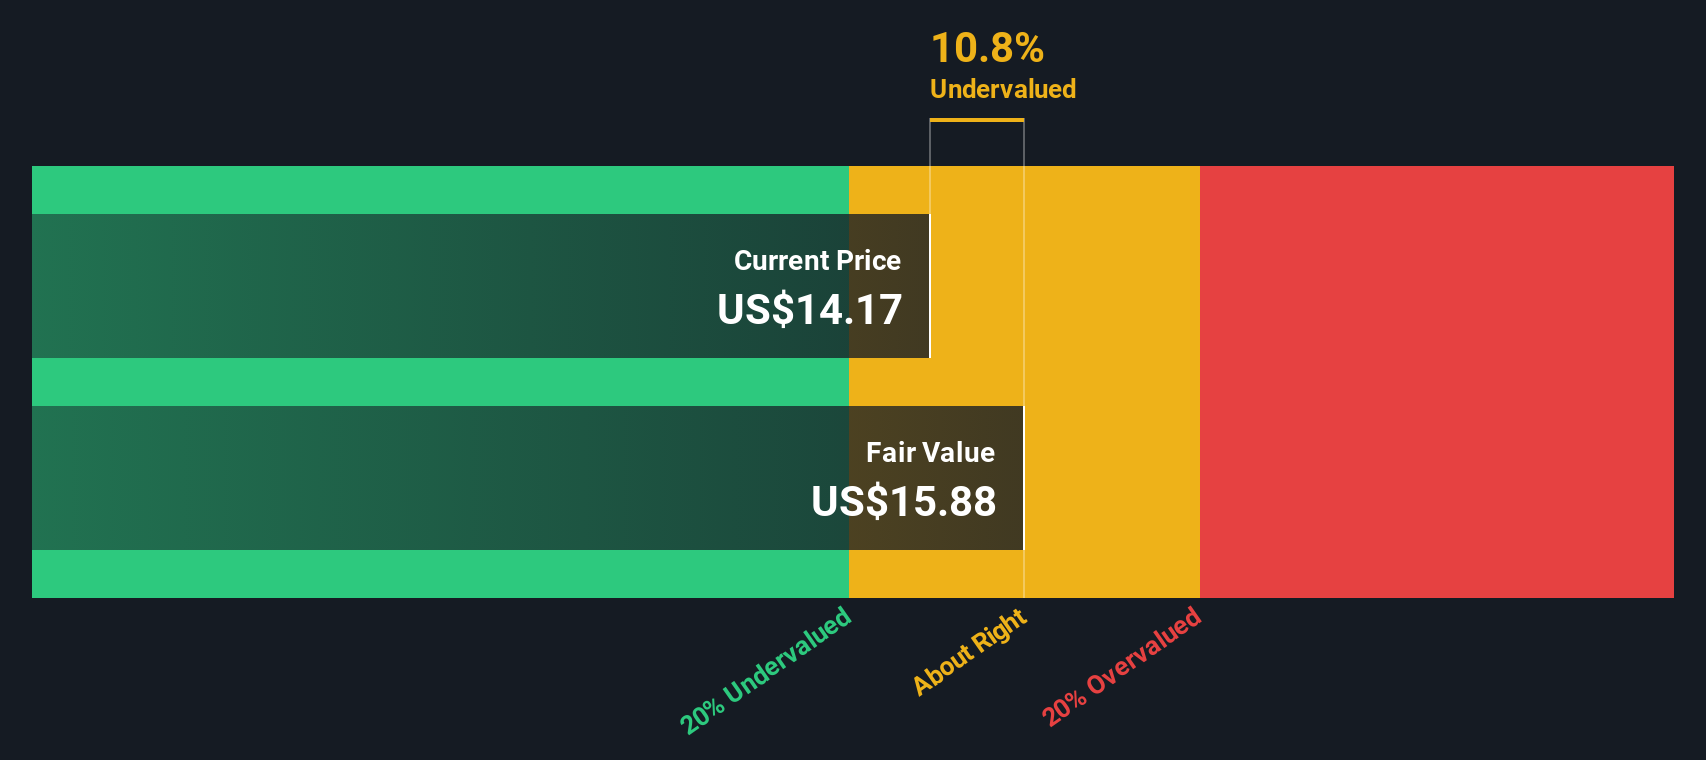
When all projected and extrapolated cash flows are discounted back to today, the model produces an estimated intrinsic value of about $16.02 per share. Compared with the recent share price of $14.95, this implies Xencor trades at roughly a 6.7% discount. This sits within a relatively narrow band around the model estimate.
Result: ABOUT RIGHT
Xencor is fairly valued according to our Discounted Cash Flow (DCF), but this can change at a moment's notice. Track the value in your watchlist or portfolio and be alerted on when to act.
Approach 2: Xencor Price vs Sales
For companies where earnings are not yet a steady guide, investors often look at revenue instead, which makes the P/S ratio a useful yardstick. You are essentially asking how many dollars you are paying today for each dollar of current annual sales, with higher ratios often linked to stronger growth expectations or lower perceived risk.
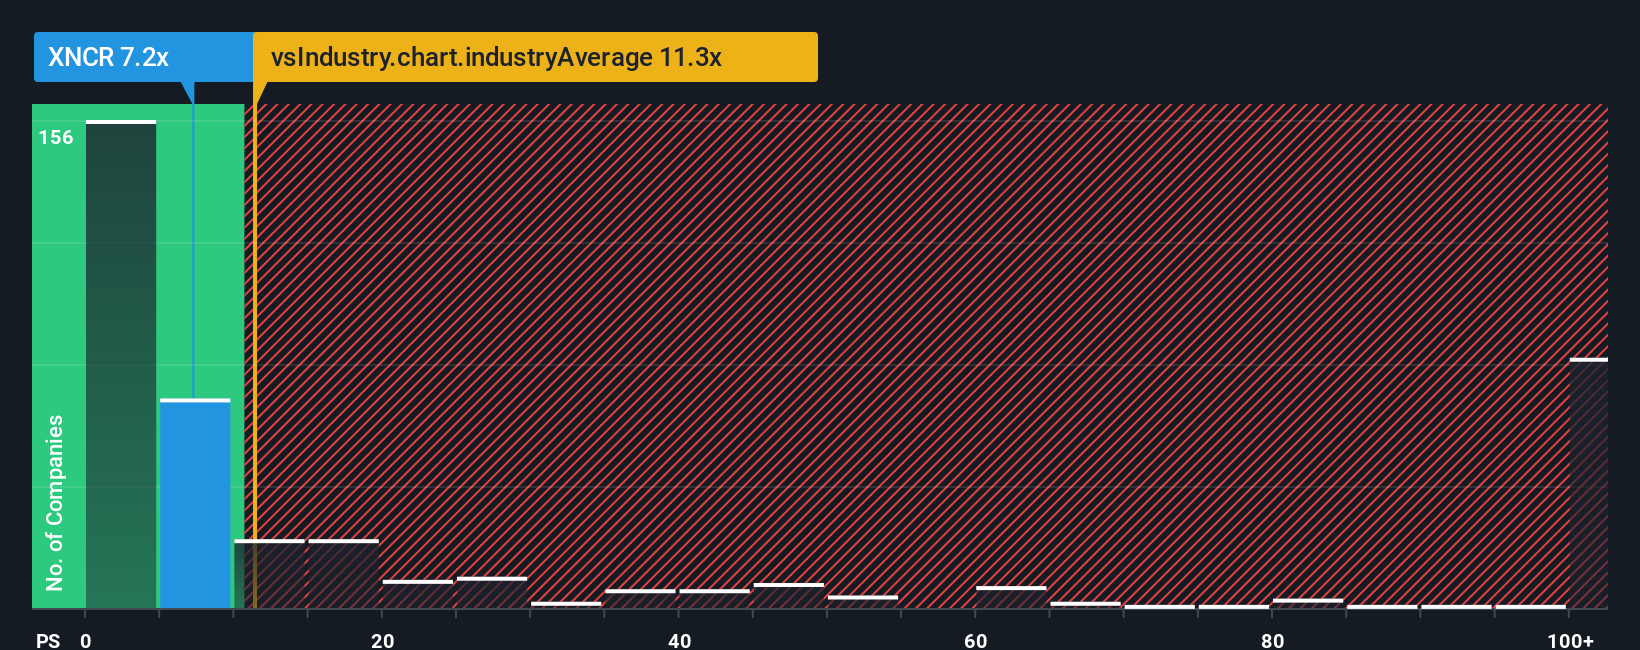
Xencor currently trades on a P/S of 7.11x. This sits below the Biotechs industry average P/S of 12.13x and also below the peer group average of 9.40x. Simply Wall St also calculates a proprietary “Fair Ratio” for Xencor of 1.45x, which reflects what its P/S might be given factors such as its revenue profile, margins, industry, market value and risk characteristics.
The Fair Ratio is more tailored than a straight comparison with peers or the sector because it brings these company specific drivers together instead of assuming that all biotech businesses deserve similar multiples. Comparing Xencor’s current 7.11x P/S to the Fair Ratio of 1.45x suggests the shares trade above what this model would point to as a more typical level.
Result: OVERVALUED
P/S ratios tell one story, but what if the real opportunity lies elsewhere? Discover 1443 companies where insiders are betting big on explosive growth.
Upgrade Your Decision Making: Choose your Xencor Narrative
Earlier we mentioned that there is an even better way to understand valuation, and on Simply Wall St that starts with Narratives. Here, you tell the story you believe about Xencor, link that story to your own revenue, earnings and margin forecasts, see the fair value that results from those assumptions, and then compare that to today’s price inside the Community page. The Narrative updates automatically as new news or earnings arrive. For example, one investor might build a bullish Xencor Narrative closer to the US$40 analyst target, while another uses the same tools to express a more cautious view nearer US$6, giving both a clear, numbers backed framework for deciding whether the current price looks attractive or stretched.
Do you think there's more to the story for Xencor? Head over to our Community to see what others are saying!

This article by Simply Wall St is general in nature. We provide commentary based on historical data and analyst forecasts only using an unbiased methodology and our articles are not intended to be financial advice. It does not constitute a recommendation to buy or sell any stock, and does not take account of your objectives, or your financial situation. We aim to bring you long-term focused analysis driven by fundamental data. Note that our analysis may not factor in the latest price-sensitive company announcements or qualitative material. Simply Wall St has no position in any stocks mentioned.
Have feedback on this article? Concerned about the content? Get in touch with us directly. Alternatively, email editorial-team@simplywallst.com