
- PREMIUM
- LIVE QUOTES
- INSTITUTIONS
 Index Options
 State Street
 CME Group
 Nasdaq
 Cboe
Cboe TradingView
 Wall Street Journal
Is Magna International (TSX:MG) Attractively Priced After 41% One Year Share Price Climb
- If you are wondering whether Magna International's current share price lines up with its underlying value, or if the market is getting ahead of itself, you are not alone.
- The stock trades at C$77.93 after returns of 6.5% over the last week, 13.9% over the last month, 3.9% year to date and 40.9% over the past year, which has put it firmly on many investors' radars.
- Recent headlines around Magna International have focused on its position as a key auto parts supplier and its exposure to trends such as vehicle electrification and advanced driver assistance systems. These themes have kept attention on how the company might be positioned within the broader automotive sector and may help explain part of the interest behind the recent share price moves.
- Magna International currently scores 3 out of 6 on our valuation checks. Next, we will look at what different valuation methods say about the stock today and then finish with a way of thinking about valuation that can be even more helpful than the models themselves.
Approach 1: Magna International Discounted Cash Flow (DCF) Analysis
A Discounted Cash Flow, or DCF, model takes estimates of the cash a company could generate in the future and discounts those cash flows back to today to arrive at an estimate of what the business may be worth now.
For Magna International, the model used here is a 2 Stage Free Cash Flow to Equity approach based on cash flow projections. The latest twelve month free cash flow is $1,472.60m. Analysts provide estimates out to 2028, with Simply Wall St extrapolating further projections to 2035 using its own assumptions.
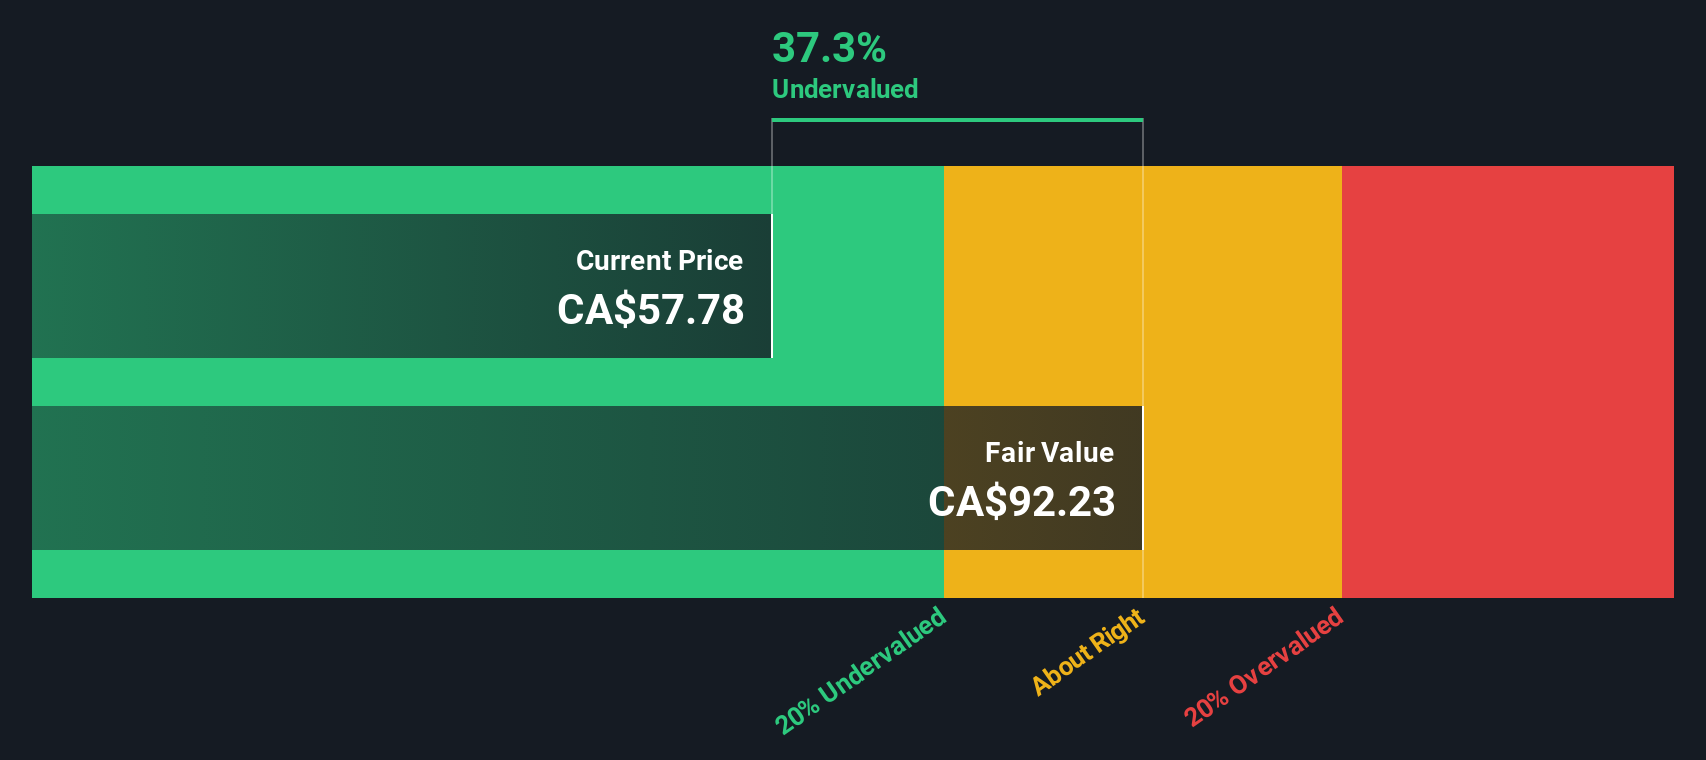
Within these projections, free cash flow for 2026 is modeled at $1,354.11m and for 2028 at $1,226.10m, with additional extrapolated figures extending to 2035. After discounting this stream of expected cash flows back to today, the DCF model arrives at an estimated intrinsic value of $95.41 per share.
Compared with the current share price of C$77.93, this DCF output implies the stock is trading at an 18.3% discount, which suggests the shares are undervalued based on these cash flow assumptions.
Result: UNDERVALUED
Our Discounted Cash Flow (DCF) analysis suggests Magna International is undervalued by 18.3%. Track this in your watchlist or portfolio, or discover 884 more undervalued stocks based on cash flows.
Approach 2: Magna International Price vs Earnings
For profitable companies like Magna International, the P/E ratio is a straightforward way to connect what you pay for each share with the earnings that support it. It lets you see how many dollars the market is currently willing to pay for one dollar of earnings.
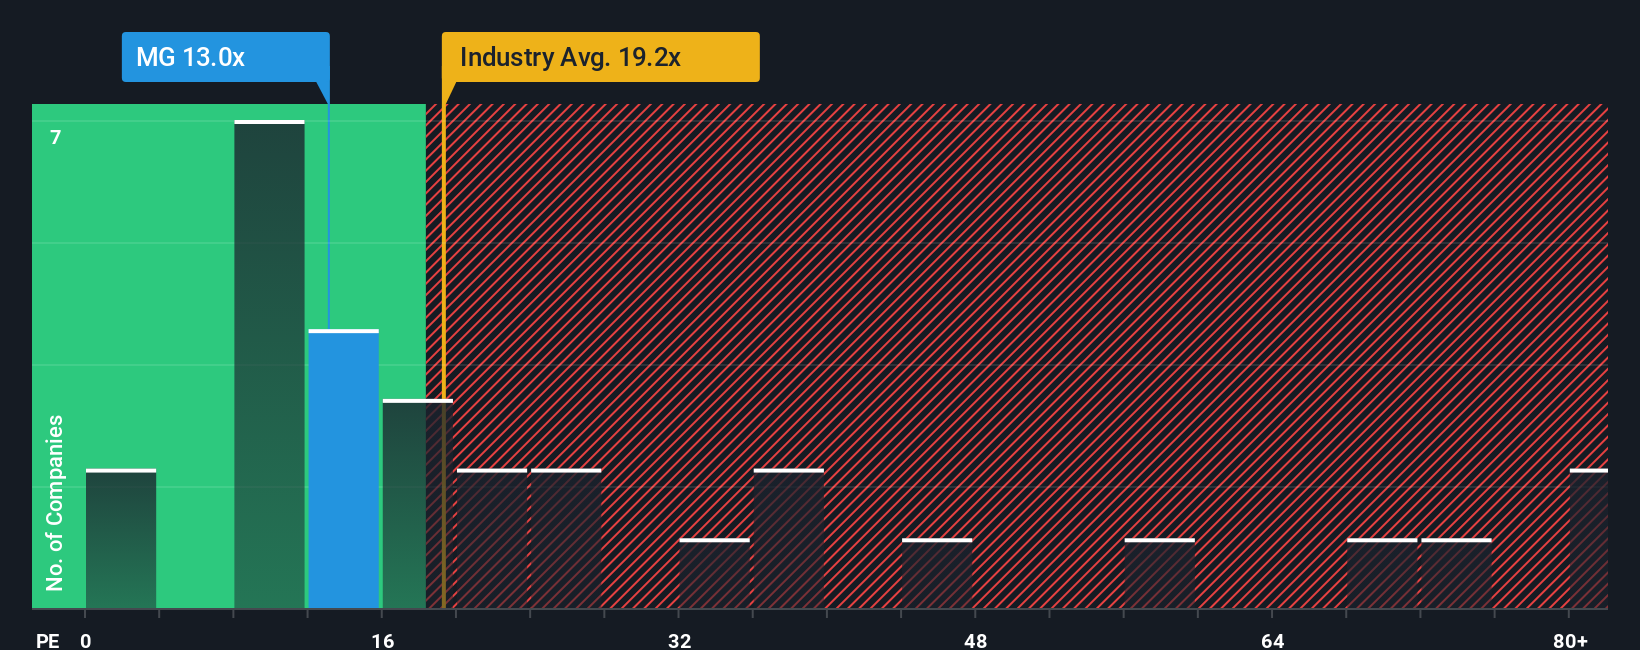
In general, higher growth expectations and lower perceived risk can justify a higher P/E ratio, while slower growth and higher risk usually support a lower one. Magna International currently trades on a P/E of 15.35x. That sits below the Auto Components industry average P/E of 21.11x and also below the peer group average of 26.18x.
Simply Wall St’s Fair Ratio is a proprietary estimate of what Magna International’s P/E should be, given its earnings growth profile, profitability, industry, market cap and specific risks. This tends to be more tailored than a simple comparison with peers or industry averages, because it adjusts for company specific strengths and weaknesses rather than assuming all firms deserve similar multiples. In this case, the Fair Ratio is not available, so there is no direct comparison with the current 15.35x P/E to indicate whether the shares look overvalued, undervalued, or about right based on this metric alone.
Result: ABOUT RIGHT
P/E ratios tell one story, but what if the real opportunity lies elsewhere? Discover 1443 companies where insiders are betting big on explosive growth.
Upgrade Your Decision Making: Choose your Magna International Narrative
Earlier we mentioned that there is an even better way to understand valuation, so let us introduce you to Narratives, which are simply your story about Magna International tied directly to your own forecasts for revenue, earnings and margins, and then to a fair value estimate you can compare with the current price on Simply Wall St’s Community page that millions of investors use. A Narrative connects what you believe about Magna International, such as how electric expansion in Europe, growth in China, share repurchases, margin targets, macro risks and foreign exchange pressures might play out, to a set of financial assumptions. For example, revenue of US$41.6b, earnings of US$1.7b, a profit margin of about 4.1%, a future P/E of about 9.3x and a fair value around US$69.38, which you can then weigh against the live share price to decide whether Magna looks attractive, fully priced, or expensive to you. On the same company, another investor might lean toward the higher CA$80.21 or the lower CA$54.51 analyst targets, and Narratives on the platform update as new earnings, news and guidance arrive, so your view on Magna can evolve without you rebuilding your analysis from scratch.
Do you think there's more to the story for Magna International? Head over to our Community to see what others are saying!

This article by Simply Wall St is general in nature. We provide commentary based on historical data and analyst forecasts only using an unbiased methodology and our articles are not intended to be financial advice. It does not constitute a recommendation to buy or sell any stock, and does not take account of your objectives, or your financial situation. We aim to bring you long-term focused analysis driven by fundamental data. Note that our analysis may not factor in the latest price-sensitive company announcements or qualitative material. Simply Wall St has no position in any stocks mentioned.
Have feedback on this article? Concerned about the content? Get in touch with us directly. Alternatively, email editorial-team@simplywallst.com