
- PREMIUM
- LIVE QUOTES
- INSTITUTIONS
 Index Options
 State Street
 CME Group
 Nasdaq
 Cboe
Cboe TradingView
 Wall Street Journal
Assessing Capricorn Metals (ASX:CMM) Valuation After Solid Karlawinda Production And Expansion Progress
Why Capricorn Metals’ latest production update matters
Capricorn Metals (ASX:CMM) recently reported 30,476oz of gold output from its Karlawinda Gold Project for the December 2025 quarter, in line with its FY26 mine plan and near the upper end of annual guidance.
The company also confirmed that construction of the Karlawinda Expansion Project is progressing, with key infrastructure milestones reached and commissioning targeted for Q1 FY27. This provides investors with more clarity on its project pipeline.
See our latest analysis for Capricorn Metals.
Capricorn Metals’ latest production update lands after a strong run, with a 1 year total shareholder return of 108.66% and a 3 year total shareholder return of about 2.8x. This comes even though the 1 day share price return was a 5.80% decline and the year to date share price return is slightly negative. This suggests momentum has cooled in the short term while longer term holders have still seen substantial gains.
If this gold producer’s progress has you thinking about where else growth stories may emerge, it could be worth widening your search with fast growing stocks with high insider ownership.
With Capricorn Metals trading at A$13.98, showing a strong 1 year total return of 109% but a slightly negative year to date move, is the recent pause a potential entry point, or is future growth already priced in?
Price-to-Earnings of 42.4x: Is it justified?
Capricorn Metals closed at A$13.98, and on a P/E of 42.4x it screens as expensive compared with the broader Australian Metals and Mining industry and its own estimated fair multiple.
The P/E ratio compares the current share price to earnings per share, so for a producer like Capricorn Metals it reflects what investors are willing to pay for each dollar of current earnings.
Here, the market is assigning a 42.4x P/E to Capricorn Metals. This is above the Australian Metals and Mining industry average of 24x and also above the estimated fair P/E of 30.9x. Investors are therefore paying a premium relative to both the sector and the level our fair ratio suggests the market could eventually gravitate toward.
On these numbers, Capricorn Metals trades on a meaningfully richer earnings multiple than the typical Australian miner while also sitting above its regression based fair ratio benchmark. This indicates investors are pricing in stronger growth or quality characteristics than the industry average.
Explore the SWS fair ratio for Capricorn Metals
Result: Price-to-Earnings of 42.4x (OVERVALUED)
However, you also need to weigh that rich 42.4x P/E against project execution risks and the recent year-to-date share price decline.
Find out about the key risks to this Capricorn Metals narrative.
Another View: What Does The DCF Say?
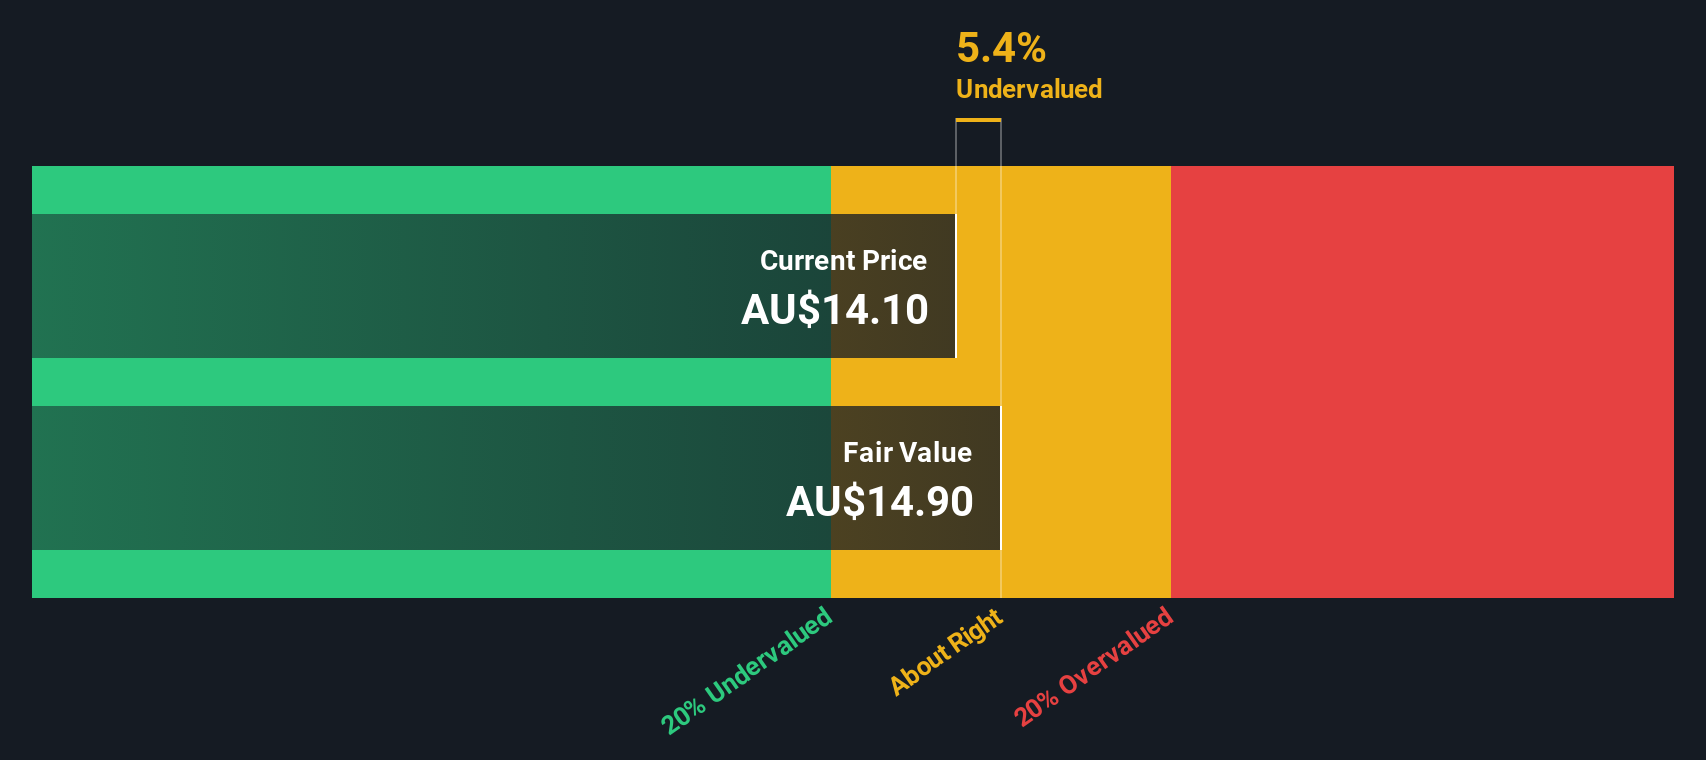
Our DCF model comes out with a fair value of A$12.88 for Capricorn Metals, compared with the current A$13.98 share price. On this basis, the stock screens as overvalued, which pushes back against the rich 42.4x P/E story.
The two methods are pointing in the same direction, suggesting limited valuation cushion if expectations around growth or project execution soften. The key question for you is whether the forecast earnings trajectory is strong enough, for long enough, to justify paying above the DCF fair value.
Look into how the SWS DCF model arrives at its fair value.
Simply Wall St performs a discounted cash flow (DCF) on every stock in the world every day (check out Capricorn Metals for example). We show the entire calculation in full. You can track the result in your watchlist or portfolio and be alerted when this changes, or use our stock screener to discover 884 undervalued stocks based on their cash flows. If you save a screener we even alert you when new companies match - so you never miss a potential opportunity.
Build Your Own Capricorn Metals Narrative
If you see the numbers differently or simply prefer to test your own assumptions, you can build a custom view in just a few minutes by starting with Do it your way.
A good starting point is our analysis highlighting 2 key rewards investors are optimistic about regarding Capricorn Metals.
Looking for more investment ideas?
If Capricorn has caught your attention, do not stop here. Broaden your watchlist with fresh ideas that line up with the way you like to invest.
- Target income-focused opportunities by scanning these 12 dividend stocks with yields > 3% that might suit investors who care about regular cash returns.
- Explore potential growth by reviewing these 26 AI penny stocks that are tied to real business models.
- Consider positioning yourself in a fast-moving theme by checking out these 79 cryptocurrency and blockchain stocks.
This article by Simply Wall St is general in nature. We provide commentary based on historical data and analyst forecasts only using an unbiased methodology and our articles are not intended to be financial advice. It does not constitute a recommendation to buy or sell any stock, and does not take account of your objectives, or your financial situation. We aim to bring you long-term focused analysis driven by fundamental data. Note that our analysis may not factor in the latest price-sensitive company announcements or qualitative material. Simply Wall St has no position in any stocks mentioned.
Have feedback on this article? Concerned about the content? Get in touch with us directly. Alternatively, email editorial-team@simplywallst.com