
- PREMIUM
- LIVE QUOTES
- INSTITUTIONS
 Index Options
 State Street
 CME Group
 Nasdaq
 Cboe
Cboe TradingView
 Wall Street Journal
Is McDonald's (MCD) Price Justified As DCF And P/E Send Mixed Signals?
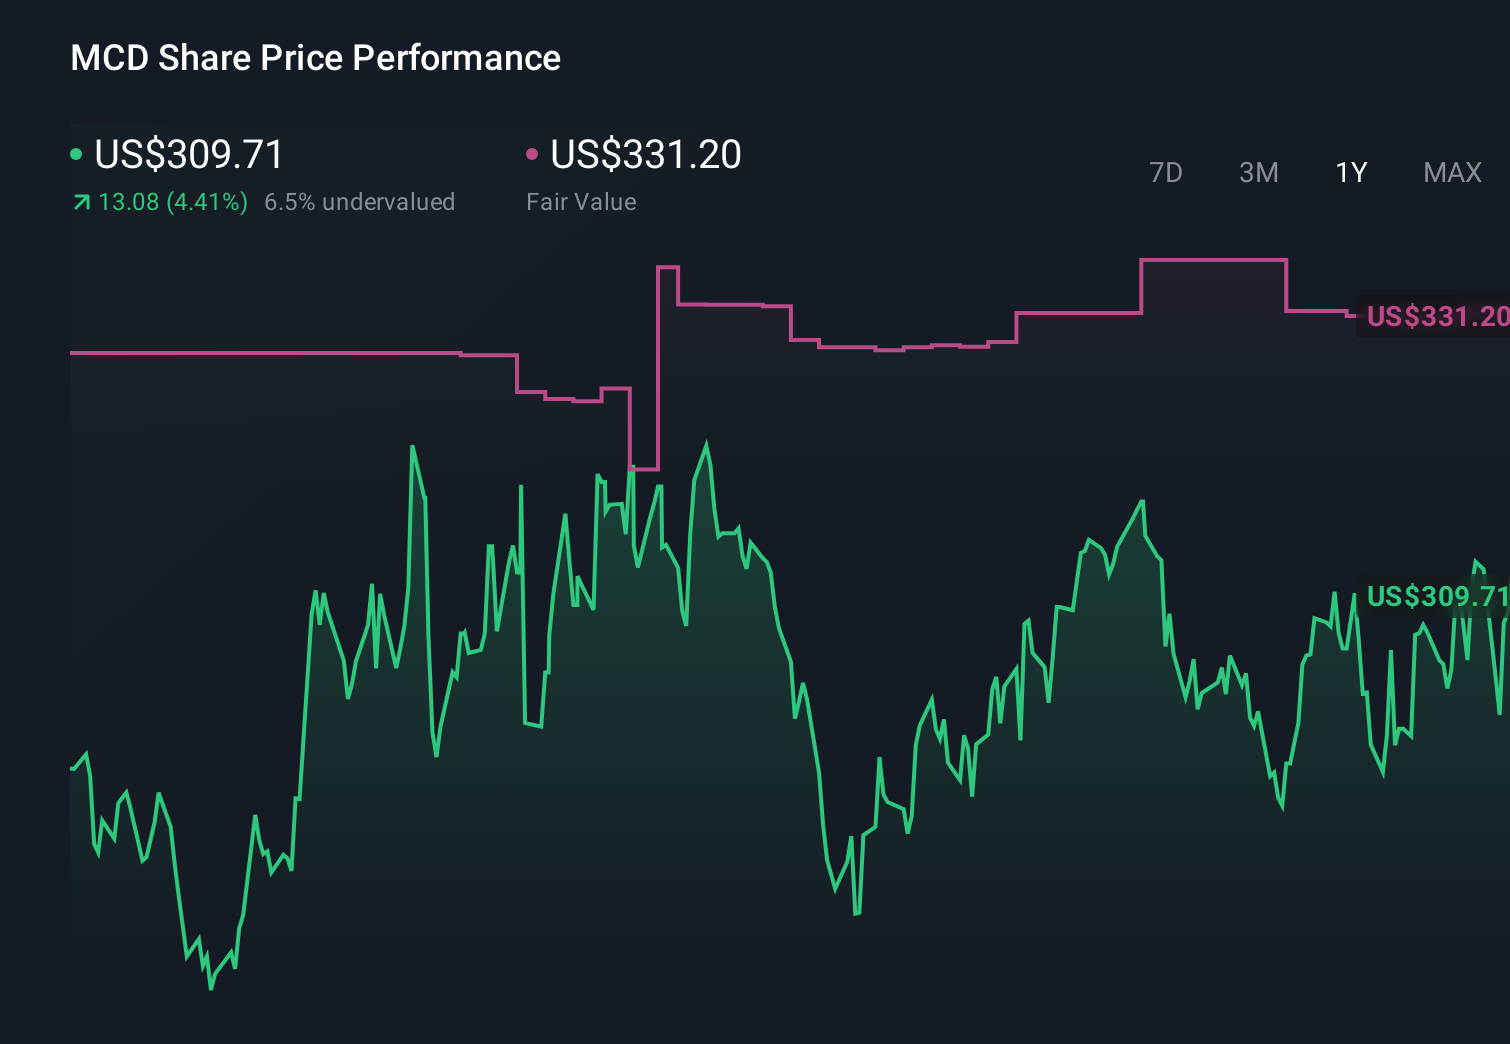
- If you are wondering whether McDonald's at around US$304 per share is offering fair value or looking stretched, you are not alone. This article is built to help you unpack that question clearly.
- The stock has been relatively steady in the short term, with a 0.5% decline over 7 days and a 1.8% decline over 30 days, while returns sit at 0.3% year to date and 8.5% over 1 year, extending to 21.3% over 3 years and 60.8% over 5 years.
- Recent attention on McDonald's has focused on its brand strength, global footprint and how it positions itself within the consumer services space. This helps frame how investors think about its long term potential and risks. These themes often sit in the background when the share price moves, even when there is no single headline event driving day to day changes.
- On our checklist style valuation summary, McDonald's scores 2 out of 6 on undervaluation checks. Next we will look at how different valuation methods line up, before finishing with a perspective that can help you make more sense of those numbers in practice.
McDonald's scores just 2/6 on our valuation checks. See what other red flags we found in the full valuation breakdown.
Approach 1: McDonald's Discounted Cash Flow (DCF) Analysis
A Discounted Cash Flow, or DCF, model looks at the cash McDonald's is expected to generate in the future and discounts those projected amounts back to today to estimate what the business might be worth right now.
For McDonald's, the model used is a 2 Stage Free Cash Flow to Equity approach, based on cash flow projections. The latest twelve month free cash flow is about $7.8b. Analyst and extrapolated estimates used in the model include free cash flow of $8.6b in 2026, $9.9b in 2027 and $10.7b in 2028, with further extrapolated figures reaching $14.4b in 2035, all in dollar terms.
Discounting those future cash flows back to today gives an estimated intrinsic value of about $255.96 per share. Compared to a recent share price around $304, this particular DCF output suggests McDonald's stock screens as about 18.8% overvalued on these assumptions.
Result: OVERVALUED
Our Discounted Cash Flow (DCF) analysis suggests McDonald's may be overvalued by 18.8%. Discover 884 undervalued stocks or create your own screener to find better value opportunities.

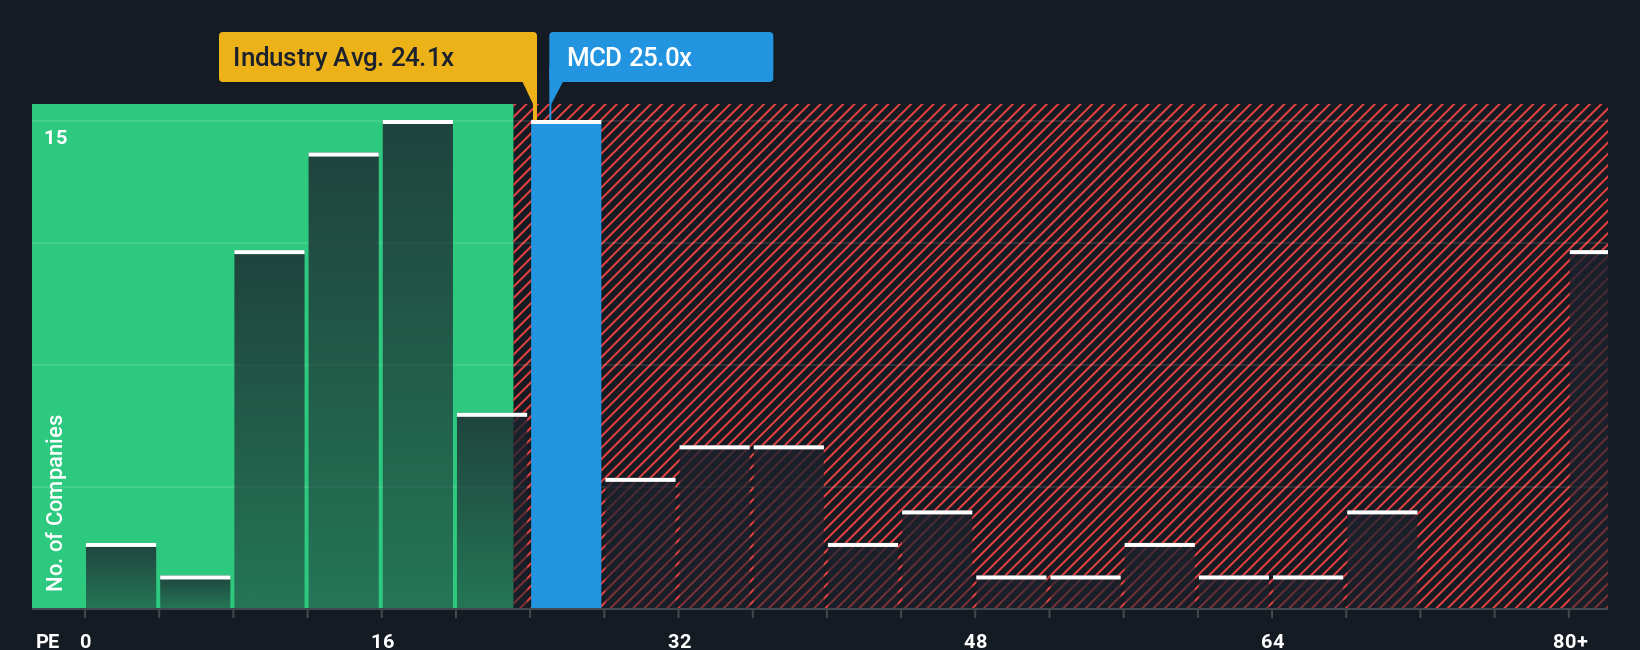
Approach 2: McDonald's Price vs Earnings
For a mature, consistently profitable company like McDonald's, the P/E ratio is a useful way to think about what you are paying for each dollar of current earnings. Investors usually accept a higher P/E when they expect stronger growth or see lower risk, and a lower P/E when they see weaker growth or higher risk.
Right now, McDonald's trades on a P/E of about 25.7x. That sits above the Hospitality industry average of around 22.8x, but below the broader peer group average near 57.6x, so the raw comparisons send a mixed signal. To sharpen this, Simply Wall St calculates a proprietary “Fair Ratio” of 30.5x, which is the P/E it would expect for McDonald's after factoring in its earnings growth profile, industry, profit margins, market value and specific risks.
This Fair Ratio aims to be more useful than simple peer or industry comparisons because it adjusts for the company’s own characteristics rather than assuming one size fits all. With the current 25.7x P/E sitting below the 30.5x Fair Ratio, this framework suggests McDonald's shares look undervalued on this earnings based approach.
Result: UNDERVALUED
P/E ratios tell one story, but what if the real opportunity lies elsewhere? Discover 1443 companies where insiders are betting big on explosive growth.
Upgrade Your Decision Making: Choose your McDonald's Narrative
Earlier we mentioned that there is an even better way to understand valuation, so let us introduce you to Narratives. These are simply your story about McDonald's linked directly to your assumptions for future revenue, earnings, margins and fair value. All of this is captured in an easy tool on Simply Wall St's Community page that updates when new information like news or earnings arrives. It helps you compare your Fair Value to the current Price so you can judge whether the stock looks attractive or stretched. For example, one McDonald's Narrative might reflect a more optimistic view closer to the US$373 analyst target, while another leans toward the more cautious US$260 end of the range. Both use the same numbers but tell very different stories about how factors like international expansion, value menus and technology investment might play out.
Do you think there's more to the story for McDonald's? Head over to our Community to see what others are saying!
This article by Simply Wall St is general in nature. We provide commentary based on historical data and analyst forecasts only using an unbiased methodology and our articles are not intended to be financial advice. It does not constitute a recommendation to buy or sell any stock, and does not take account of your objectives, or your financial situation. We aim to bring you long-term focused analysis driven by fundamental data. Note that our analysis may not factor in the latest price-sensitive company announcements or qualitative material. Simply Wall St has no position in any stocks mentioned.
Have feedback on this article? Concerned about the content? Get in touch with us directly. Alternatively, email editorial-team@simplywallst.com