
- PREMIUM
- LIVE QUOTES
- INSTITUTIONS
 Index Options
 State Street
 CME Group
 Nasdaq
 Cboe
Cboe TradingView
 Wall Street Journal
Is Kimberly-Clark (KMB) Attractive After Its Recent Share Price Weakness?
- If you are wondering whether Kimberly-Clark's current share price offers value or just more volatility, you are not alone. That is exactly what this article aims to unpack.
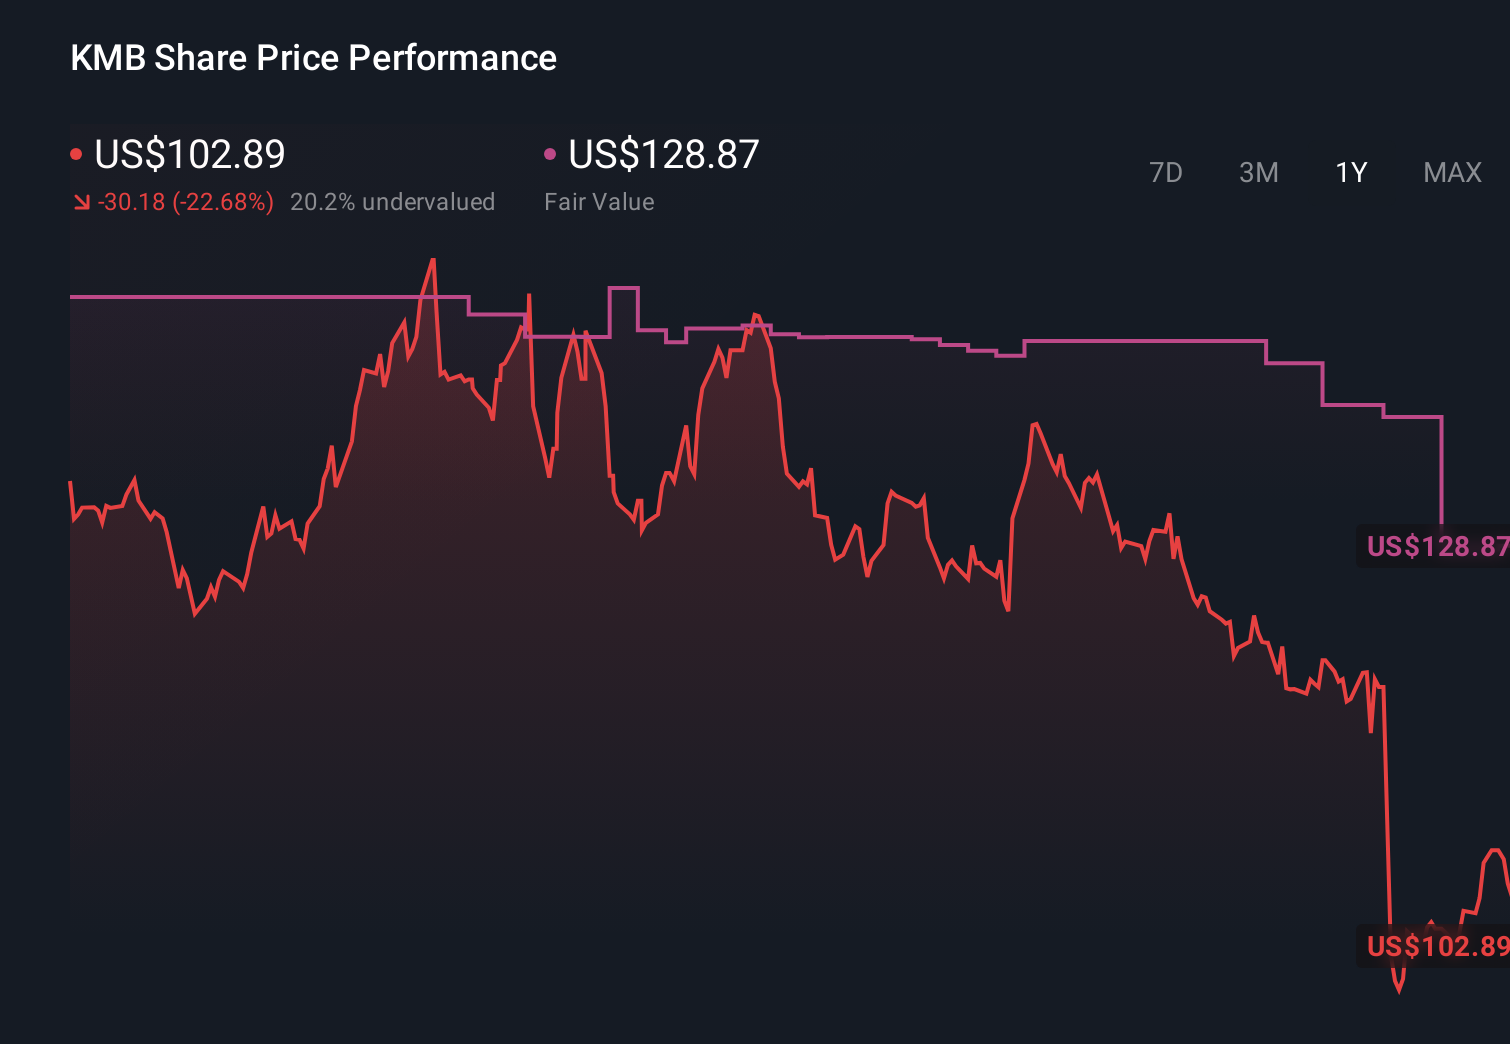
- The stock recently closed at US$97.56, after returns of a 3.3% decline over 7 days, a 4.2% decline over 30 days and a 3.8% decline year to date, adding to a 19.9% decline over 1 year, a 19.8% decline over 3 years and an 11.0% decline over 5 years.
- These share price moves have come as investors continue to reassess consumer staples names like Kimberly-Clark in light of broader market conditions and changing sentiment toward defensive stocks. With that context, it is useful to step back and focus on what the current price implies about the company's value rather than short term swings.
- On our checks, Kimberly-Clark currently scores 6 out of 6 on our valuation framework, which you can see in more detail in our valuation scorecard. Next we will walk through the main valuation approaches we use, before finishing with a way to think about valuation that goes beyond any single model.
Find out why Kimberly-Clark's -19.9% return over the last year is lagging behind its peers.
Approach 1: Kimberly-Clark Discounted Cash Flow (DCF) Analysis
A Discounted Cash Flow, or DCF, model takes the cash Kimberly-Clark is expected to generate in the future and discounts those amounts back to today using a required return. This gives an estimate of what the business might be worth in total right now.
Kimberly-Clark's latest twelve month Free Cash Flow (FCF) is about $1.79b. Analysts provide explicit FCF forecasts out to 2028, and Simply Wall St then extends these to a ten year path using a 2 Stage Free Cash Flow to Equity model. Under this approach, projected FCF rises to $12.33b in 2035, with each of those future cash flows discounted back to today's dollar terms.
Adding up those discounted cash flows produces an estimated intrinsic value of about $687.31 per share for Kimberly-Clark. Compared with the recent share price of $97.56, the DCF output suggests the stock trades at an implied 85.8% discount to this estimate. This points to a materially undervalued result on this model alone.
Result: UNDERVALUED
Our Discounted Cash Flow (DCF) analysis suggests Kimberly-Clark is undervalued by 85.8%. Track this in your watchlist or portfolio, or discover 886 more undervalued stocks based on cash flows.
Approach 2: Kimberly-Clark Price vs Earnings
For a profitable company like Kimberly-Clark, the P/E ratio is a useful yardstick because it links what you pay today to the earnings the business is already generating. Investors usually expect a higher P/E when they see stronger growth potential or lower risk, and a lower P/E when growth expectations are modest or risks feel higher.
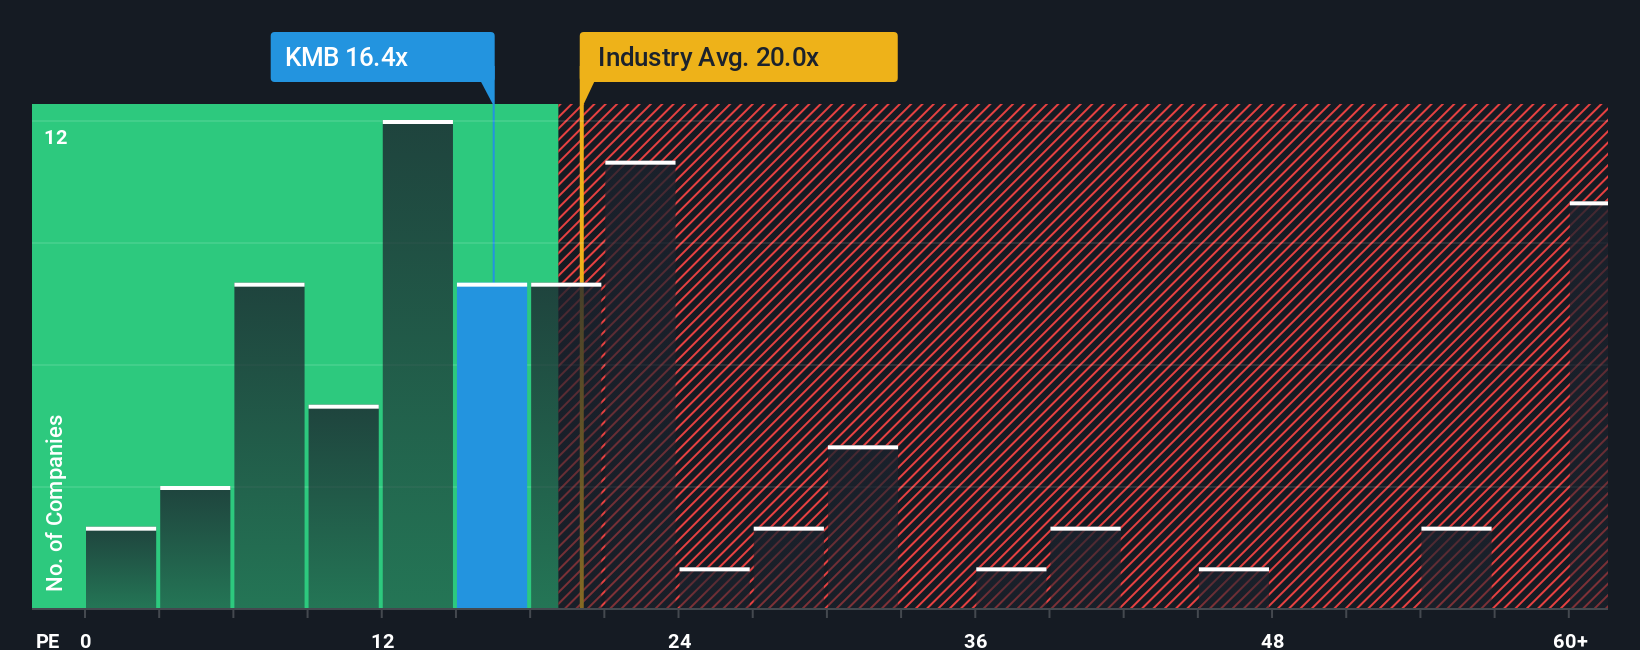
Kimberly-Clark currently trades on a P/E of 16.43x. That is close to the Household Products industry average of 16.67x and below the broader peer group average of 19.67x. Simply Wall St also calculates a Fair Ratio for Kimberly-Clark of 27.28x. This is the P/E it might trade on given its earnings growth profile, industry, profit margins, market cap and company specific risks.
This Fair Ratio is more tailored than a simple comparison with peers or the industry, because it attempts to adjust for differences in growth, risk and profitability rather than assuming all companies deserve the same multiple. Setting the current P/E of 16.43x against the Fair Ratio of 27.28x suggests Kimberly-Clark's earnings are priced below that model based estimate.
Result: UNDERVALUED
P/E ratios tell one story, but what if the real opportunity lies elsewhere? Discover 1449 companies where insiders are betting big on explosive growth.
Upgrade Your Decision Making: Choose your Kimberly-Clark Narrative
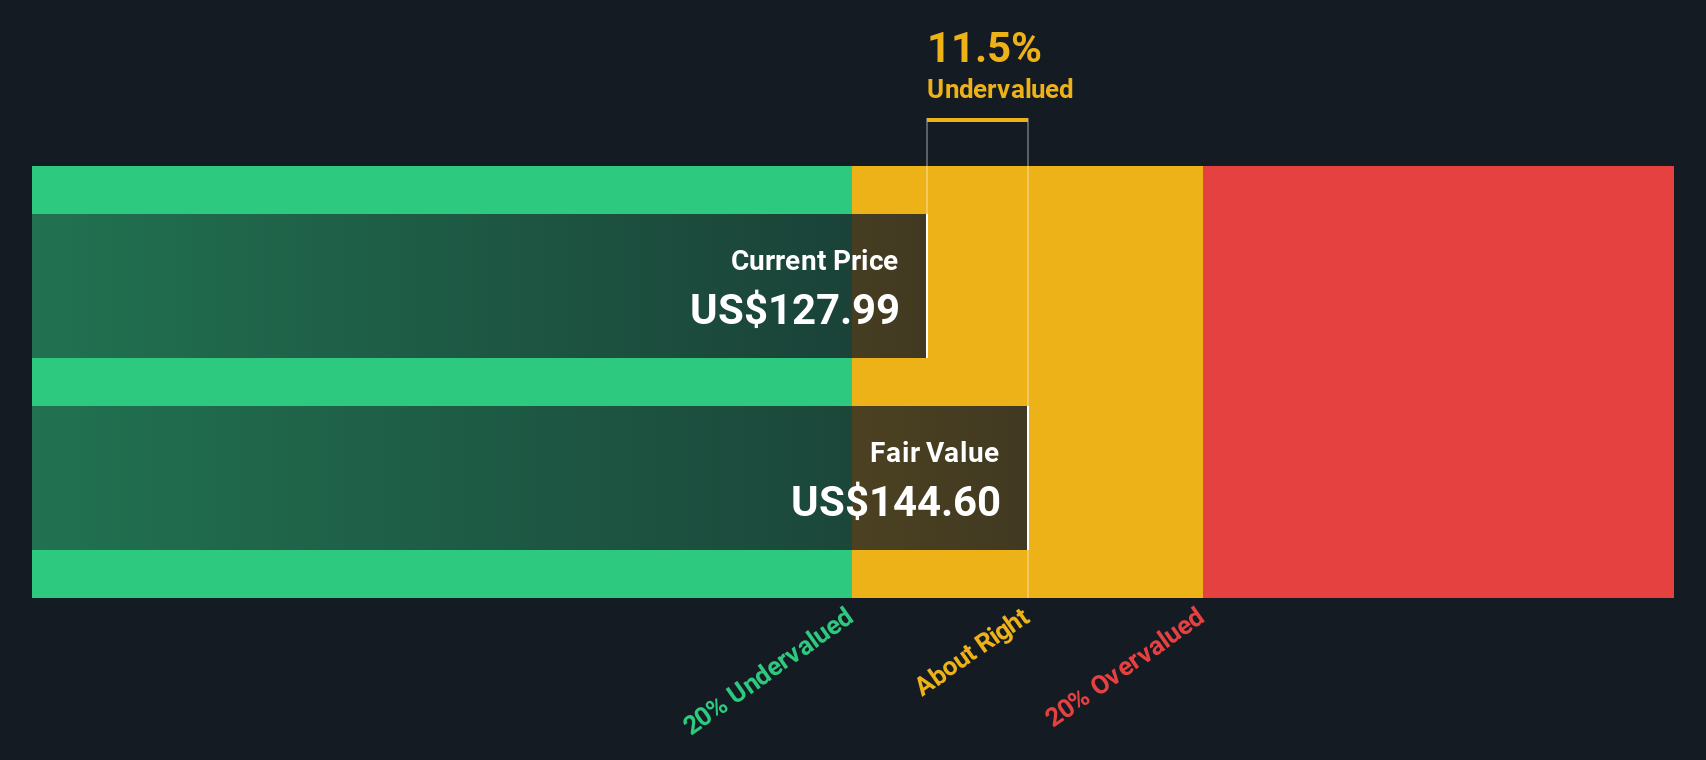
Earlier we mentioned that there is an even better way to understand valuation. On Simply Wall St's Community page you can use Narratives, where you set out your story for Kimberly-Clark, plug in your own assumptions for fair value, future revenue, earnings and margins, and the platform links that story to a forecast. It then compares your Fair Value with the current price to help you decide whether you see it as an opportunity or a risk, and keeps your view updated as new news or earnings arrive. One investor might build a Kimberly-Clark Narrative that lines up with a higher fair value such as about US$162 per share, while another might lean closer to the lower end near US$118, with each reflecting a different read on the same numbers.
Do you think there's more to the story for Kimberly-Clark? Head over to our Community to see what others are saying!
This article by Simply Wall St is general in nature. We provide commentary based on historical data and analyst forecasts only using an unbiased methodology and our articles are not intended to be financial advice. It does not constitute a recommendation to buy or sell any stock, and does not take account of your objectives, or your financial situation. We aim to bring you long-term focused analysis driven by fundamental data. Note that our analysis may not factor in the latest price-sensitive company announcements or qualitative material. Simply Wall St has no position in any stocks mentioned.
Have feedback on this article? Concerned about the content? Get in touch with us directly. Alternatively, email editorial-team@simplywallst.com