
- PREMIUM
- LIVE QUOTES
- INSTITUTIONS
 Index Options
 State Street
 CME Group
 Nasdaq
 Cboe
Cboe TradingView
 Wall Street Journal
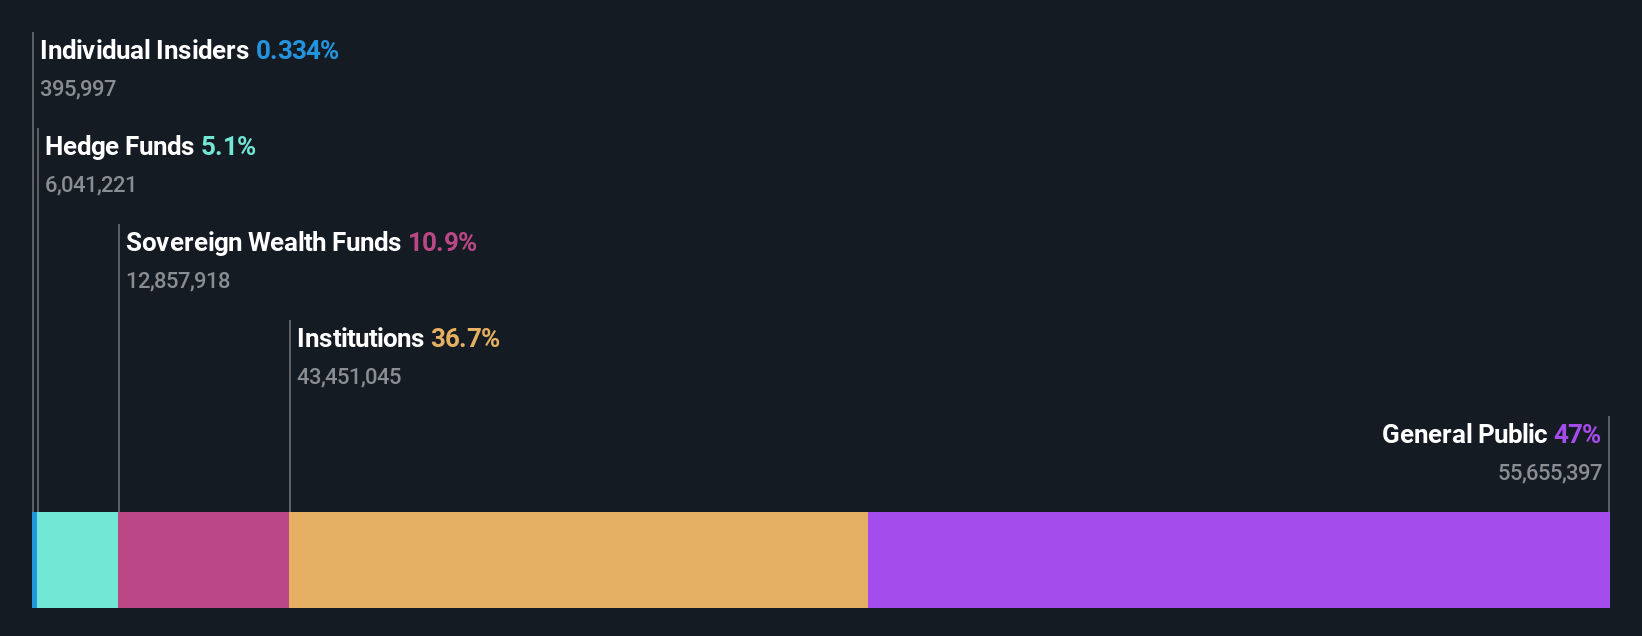
TietoEVRY Oyj's (HEL:TIETO) top owners are individual investors with 47% stake, while 37% is held by institutions
Key Insights
- The considerable ownership by individual investors in TietoEVRY Oyj indicates that they collectively have a greater say in management and business strategy
- A total of 15 investors have a majority stake in the company with 50% ownership
- 37% of TietoEVRY Oyj is held by Institutions
To get a sense of who is truly in control of TietoEVRY Oyj (HEL:TIETO), it is important to understand the ownership structure of the business. We can see that individual investors own the lion's share in the company with 47% ownership. In other words, the group stands to gain the most (or lose the most) from their investment into the company.
Institutions, on the other hand, account for 37% of the company's stockholders. Institutions often own shares in more established companies, while it's not unusual to see insiders own a fair bit of smaller companies.
Let's take a closer look to see what the different types of shareholders can tell us about TietoEVRY Oyj.
Check out our latest analysis for TietoEVRY Oyj
What Does The Institutional Ownership Tell Us About TietoEVRY Oyj?
Many institutions measure their performance against an index that approximates the local market. So they usually pay more attention to companies that are included in major indices.
TietoEVRY Oyj already has institutions on the share registry. Indeed, they own a respectable stake in the company. This implies the analysts working for those institutions have looked at the stock and they like it. But just like anyone else, they could be wrong. When multiple institutions own a stock, there's always a risk that they are in a 'crowded trade'. When such a trade goes wrong, multiple parties may compete to sell stock fast. This risk is higher in a company without a history of growth. You can see TietoEVRY Oyj's historic earnings and revenue below, but keep in mind there's always more to the story.

It looks like hedge funds own 5.1% of TietoEVRY Oyj shares. That worth noting, since hedge funds are often quite active investors, who may try to influence management. Many want to see value creation (and a higher share price) in the short term or medium term. Looking at our data, we can see that the largest shareholder is Silchester International Investors LLP with 15% of shares outstanding. With 11% and 5.1% of the shares outstanding respectively, Solidium Oy and Incentive AS are the second and third largest shareholders.
After doing some more digging, we found that the top 15 have the combined ownership of 50% in the company, suggesting that no single shareholder has significant control over the company.
While studying institutional ownership for a company can add value to your research, it is also a good practice to research analyst recommendations to get a deeper understand of a stock's expected performance. There are plenty of analysts covering the stock, so it might be worth seeing what they are forecasting, too.
Insider Ownership Of TietoEVRY Oyj
The definition of company insiders can be subjective and does vary between jurisdictions. Our data reflects individual insiders, capturing board members at the very least. Company management run the business, but the CEO will answer to the board, even if he or she is a member of it.
Insider ownership is positive when it signals leadership are thinking like the true owners of the company. However, high insider ownership can also give immense power to a small group within the company. This can be negative in some circumstances.
Our information suggests that TietoEVRY Oyj insiders own under 1% of the company. Keep in mind that it's a big company, and the insiders own €7.4m worth of shares. The absolute value might be more important than the proportional share. It is always good to see at least some insider ownership, but it might be worth checking if those insiders have been selling.
General Public Ownership
The general public, who are usually individual investors, hold a 47% stake in TietoEVRY Oyj. This size of ownership, while considerable, may not be enough to change company policy if the decision is not in sync with other large shareholders.
Next Steps:
It's always worth thinking about the different groups who own shares in a company. But to understand TietoEVRY Oyj better, we need to consider many other factors. For example, we've discovered 2 warning signs for TietoEVRY Oyj that you should be aware of before investing here.
If you would prefer discover what analysts are predicting in terms of future growth, do not miss this free report on analyst forecasts.
NB: Figures in this article are calculated using data from the last twelve months, which refer to the 12-month period ending on the last date of the month the financial statement is dated. This may not be consistent with full year annual report figures.
Have feedback on this article? Concerned about the content? Get in touch with us directly. Alternatively, email editorial-team (at) simplywallst.com.
This article by Simply Wall St is general in nature. We provide commentary based on historical data and analyst forecasts only using an unbiased methodology and our articles are not intended to be financial advice. It does not constitute a recommendation to buy or sell any stock, and does not take account of your objectives, or your financial situation. We aim to bring you long-term focused analysis driven by fundamental data. Note that our analysis may not factor in the latest price-sensitive company announcements or qualitative material. Simply Wall St has no position in any stocks mentioned.