
- PREMIUM
- LIVE QUOTES
- INSTITUTIONS
 Index Options
 State Street
 CME Group
 Nasdaq
 Cboe
Cboe TradingView
 Wall Street Journal
Is It Too Late To Consider Woodward (WWD) After Its Strong Multi Year Rally?
- If you are wondering whether Woodward's current share price reflects its true worth, you are not alone. This article is here to unpack that question in a clear, practical way.
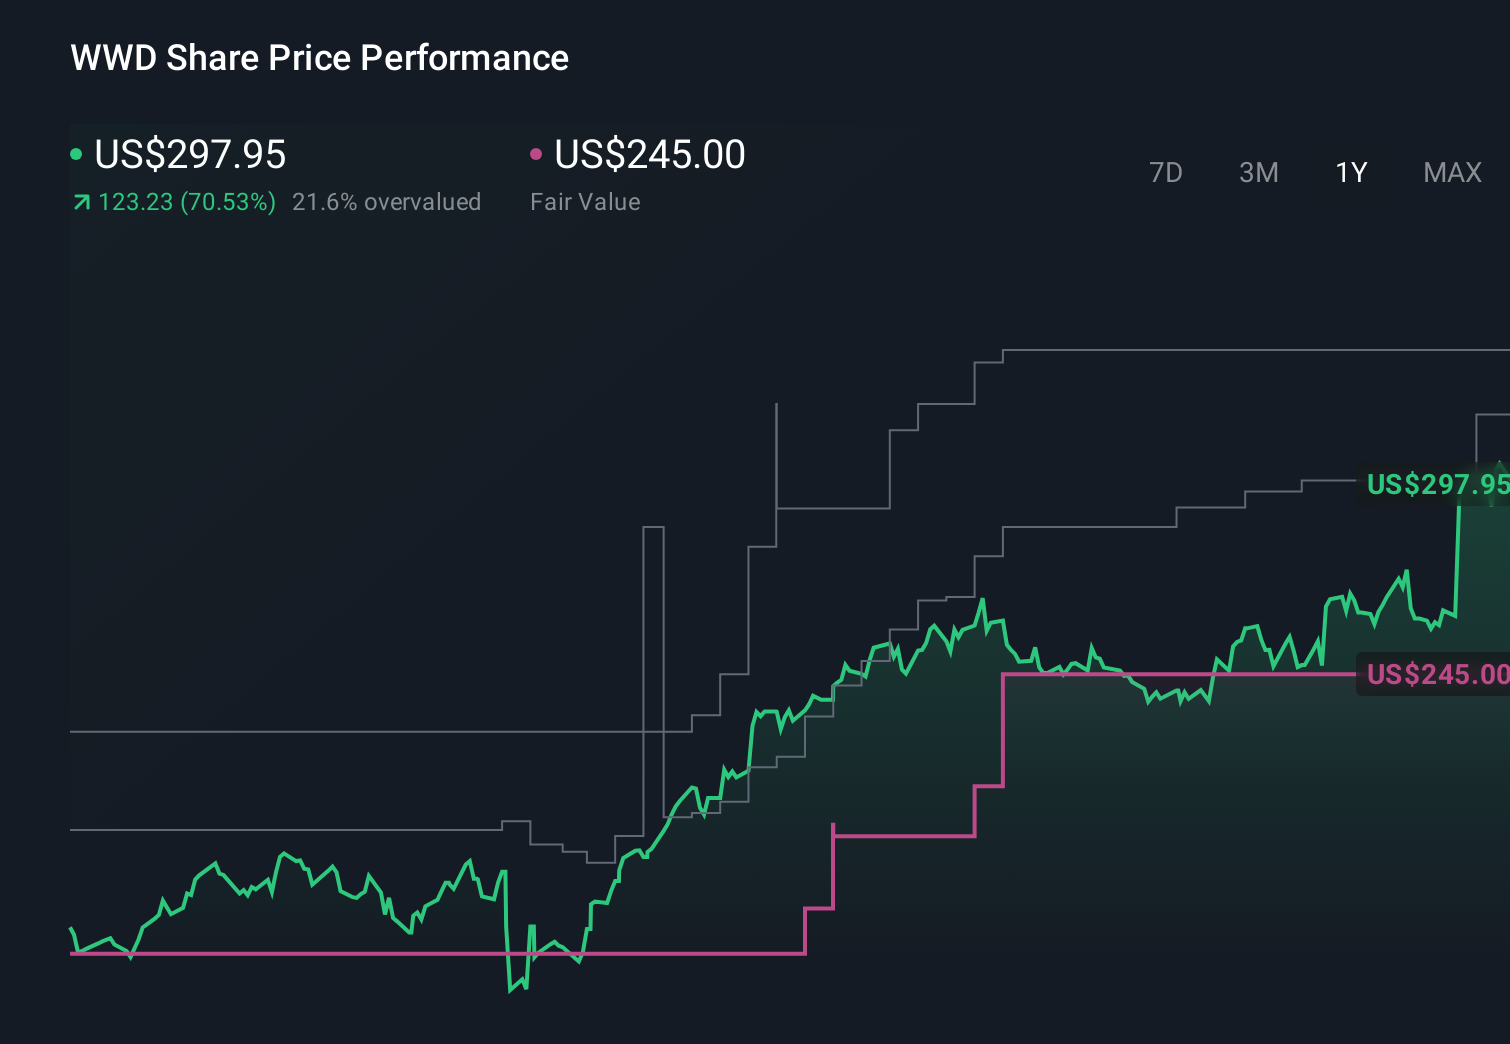
- The stock recently closed at US$322.59, with returns of 6.7% over the last week, 8.1% over the last month, 3.8% year to date, 78.0% over the past year and 218.2% over three years. This naturally raises questions about how much of the story is already priced in.
- Recent coverage of Woodward has focused on its position in the capital goods space and how investors view its long term prospects. This helps frame these returns in the context of sentiment rather than short term noise. This backdrop matters because it shapes how investors assess whether the current price is an opportunity or a source of added risk.
- On our checks, Woodward scores 1 out of 6 on our valuation framework, which you can see in more detail in its valuation score. Next we will look at what different valuation approaches are saying today and finish by considering a broader way to think about value that many investors overlook.
Woodward scores just 1/6 on our valuation checks. See what other red flags we found in the full valuation breakdown.
Approach 1: Woodward Discounted Cash Flow (DCF) Analysis
A Discounted Cash Flow, or DCF, model estimates what a company might be worth by projecting its future cash flows and then discounting those back to today at an appropriate rate. It is essentially asking what Woodward’s expected future cash generation is worth in today’s dollars.
For Woodward, the model used is a 2 Stage Free Cash Flow to Equity approach, based on projected free cash flows available to shareholders. The latest twelve month free cash flow is about $360.8 million, and analysts provide specific estimates out to 2028, with Simply Wall St extrapolating cash flows further out to 2035. For example, the 2028 free cash flow projection is $554.7 million, and by 2035 the extrapolated figure in the model reaches $902.3 million, all in US$ terms.
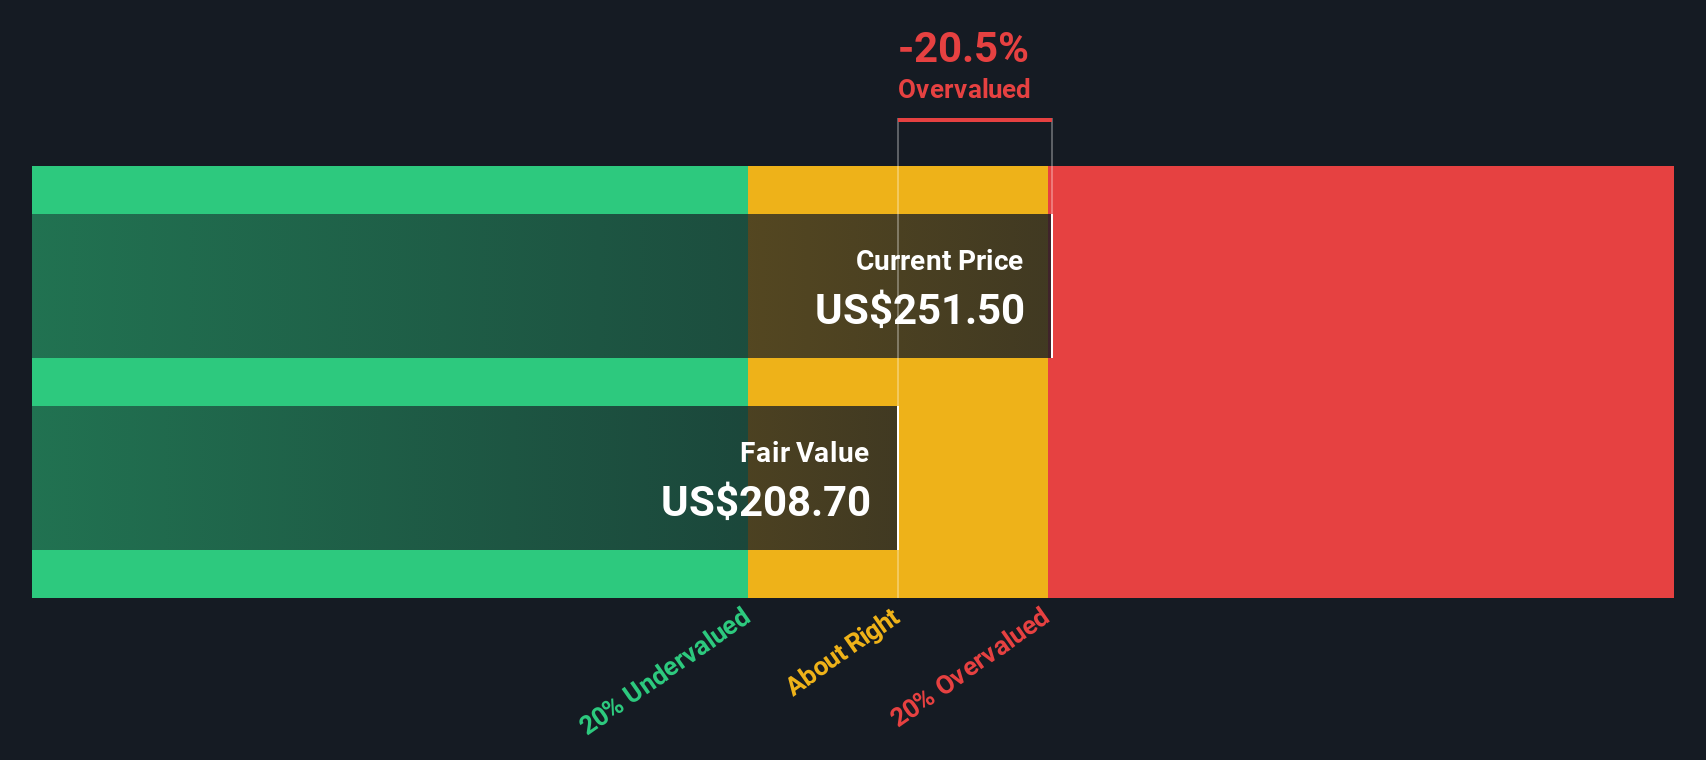
When all these projected cash flows are discounted back and summed, the DCF model arrives at an estimated intrinsic value of about $241.50 per share. Compared with the recent share price of $322.59, this implies the stock is about 33.6% above the model’s estimate of fair value, so on this measure Woodward screens as overvalued today.
Result: OVERVALUED
Our Discounted Cash Flow (DCF) analysis suggests Woodward may be overvalued by 33.6%. Discover 885 undervalued stocks or create your own screener to find better value opportunities.
Approach 2: Woodward Price vs Earnings
For profitable companies, the P/E ratio is a straightforward way to link what you pay for each share to the earnings that each share generates. It lets you see how many dollars investors are currently willing to pay for one dollar of earnings.
What counts as a “normal” P/E depends a lot on how fast earnings are expected to grow and how risky those earnings are. Higher expected growth or lower perceived risk can support a higher P/E, while slower growth or higher uncertainty usually means a lower one.
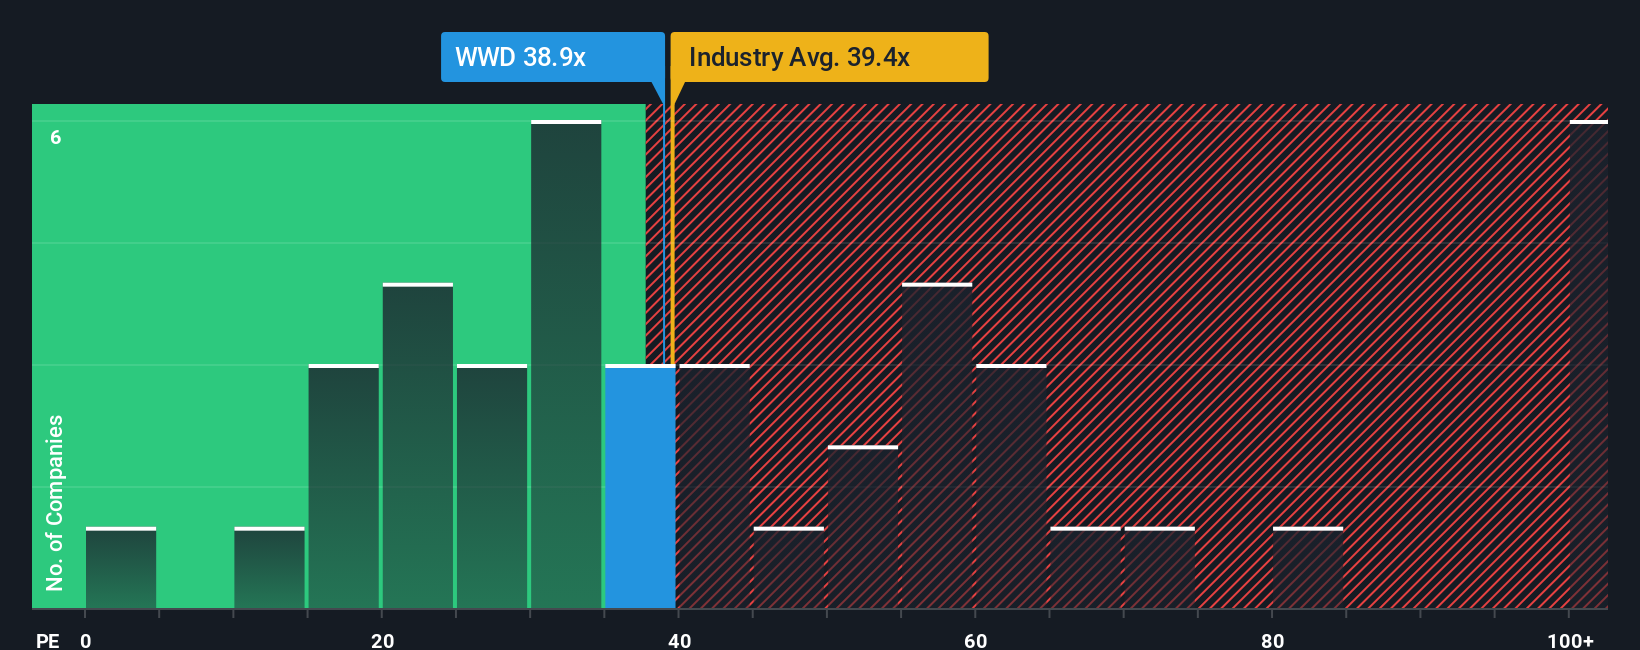
Woodward currently trades on a P/E of 43.78x, compared with an Aerospace & Defense industry average of 40.43x and a peer group average of 45.35x. Simply Wall St’s Fair Ratio for Woodward is 27.84x. This Fair Ratio is a proprietary estimate of what P/E might make sense given factors like the company’s earnings growth profile, profit margins, market cap, risk characteristics and its industry.
Because the Fair Ratio blends these company specific drivers, it can give a more tailored view than a simple comparison with peers or the broad industry. When set against this 27.84x Fair Ratio, Woodward’s current 43.78x P/E points to a valuation that is meaningfully higher than that model suggests.
Result: OVERVALUED
P/E ratios tell one story, but what if the real opportunity lies elsewhere? Discover 1449 companies where insiders are betting big on explosive growth.
Upgrade Your Decision Making: Choose your Woodward Narrative
Earlier we mentioned that there is an even better way to understand valuation, so let us introduce you to Narratives. These are simply your story about Woodward turned into a set of numbers like your fair value, and your expectations for its future revenue, earnings and margins, all linked together in one place on Simply Wall St's Community page and automatically refreshed when new earnings or news arrive. This allows you to compare your fair value to the live share price and decide whether that gap looks like a buying opportunity or a reason to be cautious. Other investors may hold very different Woodward Narratives, such as one anchored around a higher fair value closer to US$335 based on stronger long term prospects, or a more cautious view nearer US$245 that places more weight on execution risks and capital intensity.
Do you think there's more to the story for Woodward? Head over to our Community to see what others are saying!
This article by Simply Wall St is general in nature. We provide commentary based on historical data and analyst forecasts only using an unbiased methodology and our articles are not intended to be financial advice. It does not constitute a recommendation to buy or sell any stock, and does not take account of your objectives, or your financial situation. We aim to bring you long-term focused analysis driven by fundamental data. Note that our analysis may not factor in the latest price-sensitive company announcements or qualitative material. Simply Wall St has no position in any stocks mentioned.
Have feedback on this article? Concerned about the content? Get in touch with us directly. Alternatively, email editorial-team@simplywallst.com