
- PREMIUM
- LIVE QUOTES
- INSTITUTIONS
 Index Options
 State Street
 CME Group
 Nasdaq
 Cboe
Cboe TradingView
 Wall Street Journal
Is RingCentral (RNG) Pricing Reflect Its Cash Flow Forecasts And Depressed P/S Ratio Today
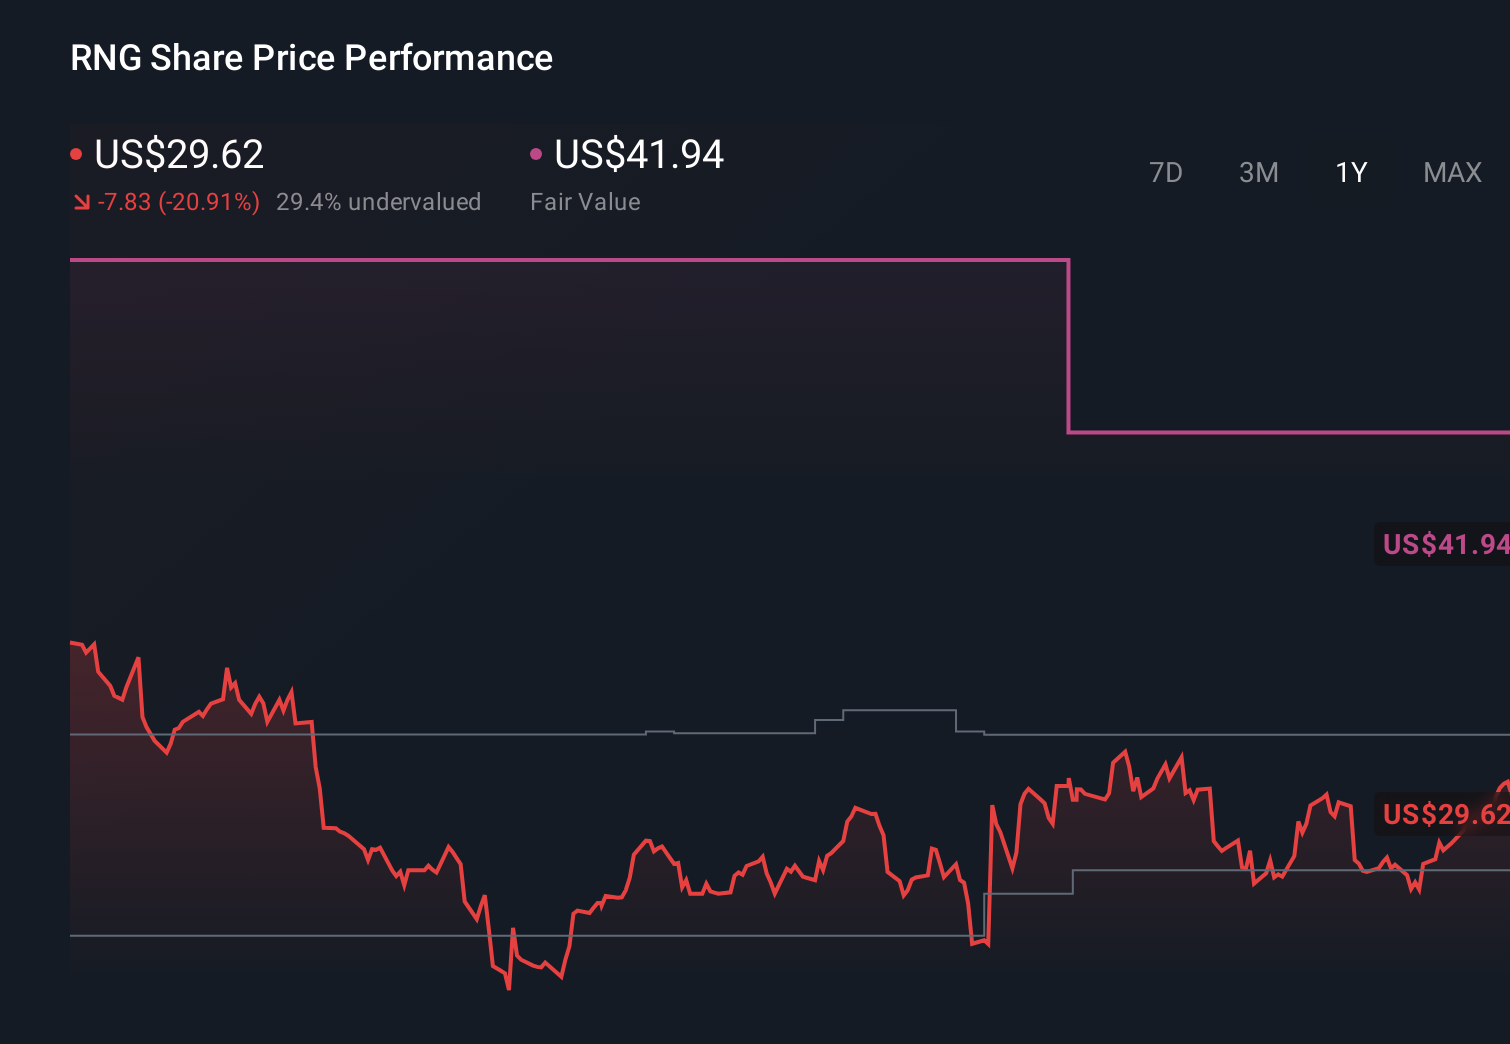
- If you are looking at RingCentral and wondering whether the current price really reflects what the business is worth, you are not alone.
- The stock last closed at US$29.08, with a 0.7% move over the past week, a 1.7% decline over 30 days, a 5.4% gain year to date, and a 13.4% decline over the past year. The 3 year and 5 year returns stand at 20.0% and 92.5% declines, respectively.
- These mixed returns sit against a backdrop of ongoing interest in cloud communications and changing expectations for how often customers might switch or consolidate providers. Recent updates around competition in business communications and investor attention on software names generally have added more focus to how much risk is being priced into RingCentral at current levels.
- On our checks, RingCentral scores a 5 out of 6 valuation score, which raises a fair question about what different methods suggest for its value today, and whether there is an even better way to assess that value that we will come back to at the end of this article.
Find out why RingCentral's -13.4% return over the last year is lagging behind its peers.
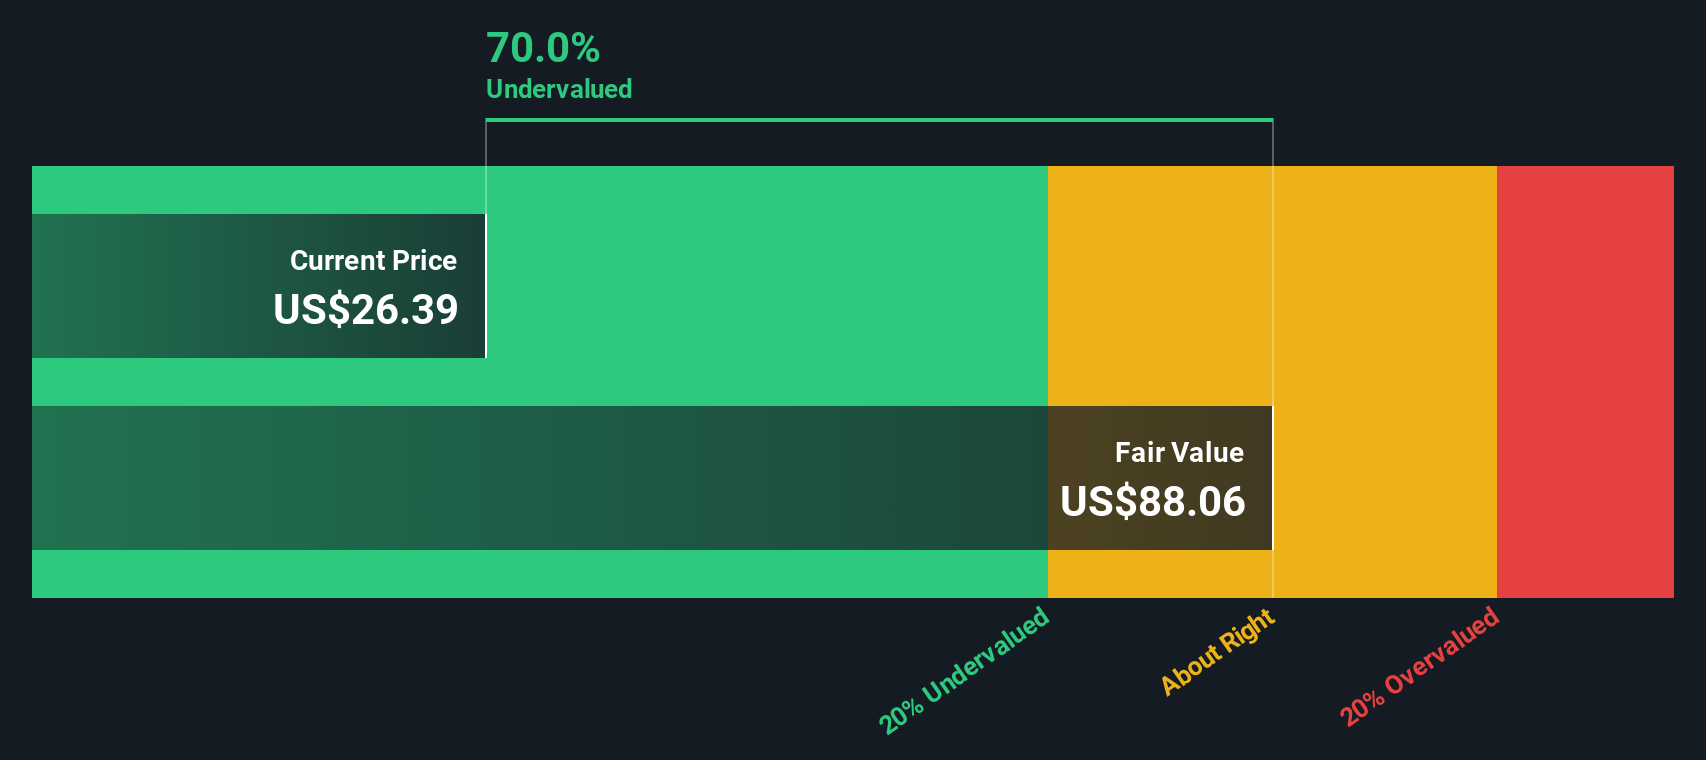
Approach 1: RingCentral Discounted Cash Flow (DCF) Analysis
A Discounted Cash Flow model takes estimates of future cash the business might generate, then discounts those amounts back to today to arrive at an estimate of what the entire company could be worth right now.
For RingCentral, the model uses a 2 Stage Free Cash Flow to Equity approach based on cash flow projections. The latest twelve month free cash flow is about $513.9 million. Analyst inputs and extrapolated estimates point to projected free cash flow of $675.7 million in 2030, with intermediate years such as 2026 to 2029 ranging from $555.3 million to $619.8 million.
When all those projected cash flows are discounted back using this DCF approach, Simply Wall St arrives at an estimated intrinsic value of about $106.04 per share. Compared with the recent share price of US$29.08, that implies a 72.6% discount, which suggests the stock screens as materially undervalued on this model alone.
Result: UNDERVALUED
Our Discounted Cash Flow (DCF) analysis suggests RingCentral is undervalued by 72.6%. Track this in your watchlist or portfolio, or discover 885 more undervalued stocks based on cash flows.
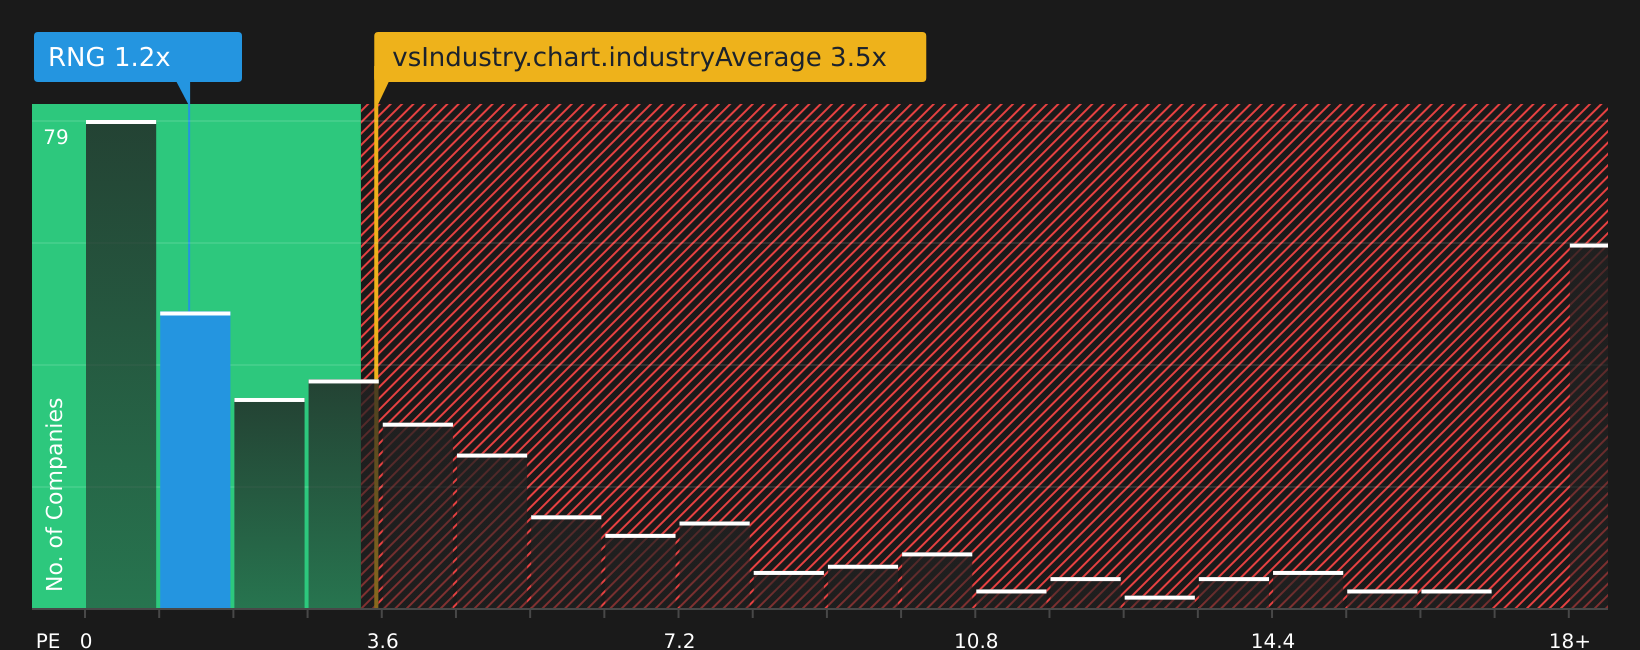
Approach 2: RingCentral Price vs Sales
For many software businesses, revenue is a cleaner yardstick than earnings, so the P/S ratio is often a practical way to compare how the market is valuing each dollar of sales. What investors are willing to pay per dollar of revenue tends to reflect both what they expect for future growth and how risky they think that revenue stream might be.
RingCentral currently trades on a P/S ratio of 1.00x. That sits well below the Software industry average of 4.82x and also below the peer group average of 4.27x. On the surface, that points to a lower valuation being applied to RingCentral’s revenue than to many of its industry peers.
Simply Wall St’s Fair Ratio for RingCentral is 3.34x. This is a proprietary estimate of what a more appropriate P/S multiple could be, based on factors like earnings growth, profit margins, industry, market capitalization and specific risks. Because it is tailored to the company’s profile, it can give a more rounded view than a simple comparison with broad industry or peer averages. With the current P/S at 1.00x versus a Fair Ratio of 3.34x, the shares screen as undervalued on this approach.
Result: UNDERVALUED
P/S ratios tell one story, but what if the real opportunity lies elsewhere? Discover 1449 companies where insiders are betting big on explosive growth.
Upgrade Your Decision Making: Choose your RingCentral Narrative
Earlier we mentioned that there is an even better way to understand valuation. Let us introduce you to Narratives, which are simple stories you create about RingCentral that connect your assumptions about future revenue, earnings, margins and fair value with the current share price. On Simply Wall St’s Community page you can quickly see how your fair value compares with today’s price, watch that view update when new news or earnings arrive, and understand why one investor might see RingCentral as worth US$55.00 a share while another thinks US$27.00 is more appropriate, all based on the story they believe in and the numbers they attach to it.
Do you think there's more to the story for RingCentral? Head over to our Community to see what others are saying!
This article by Simply Wall St is general in nature. We provide commentary based on historical data and analyst forecasts only using an unbiased methodology and our articles are not intended to be financial advice. It does not constitute a recommendation to buy or sell any stock, and does not take account of your objectives, or your financial situation. We aim to bring you long-term focused analysis driven by fundamental data. Note that our analysis may not factor in the latest price-sensitive company announcements or qualitative material. Simply Wall St has no position in any stocks mentioned.
Have feedback on this article? Concerned about the content? Get in touch with us directly. Alternatively, email editorial-team@simplywallst.com