
Shanti Gold International Limited's (NSE:SHANTIGOLD) most bullish insider, CEO Pankajkumar Jagawat must be pleased with the recent 17% gain
Key Insights
- Insiders appear to have a vested interest in Shanti Gold International's growth, as seen by their sizeable ownership
- The top 2 shareholders own 75% of the company
- Using data from company's past performance alongside ownership research, one can better assess the future performance of a company
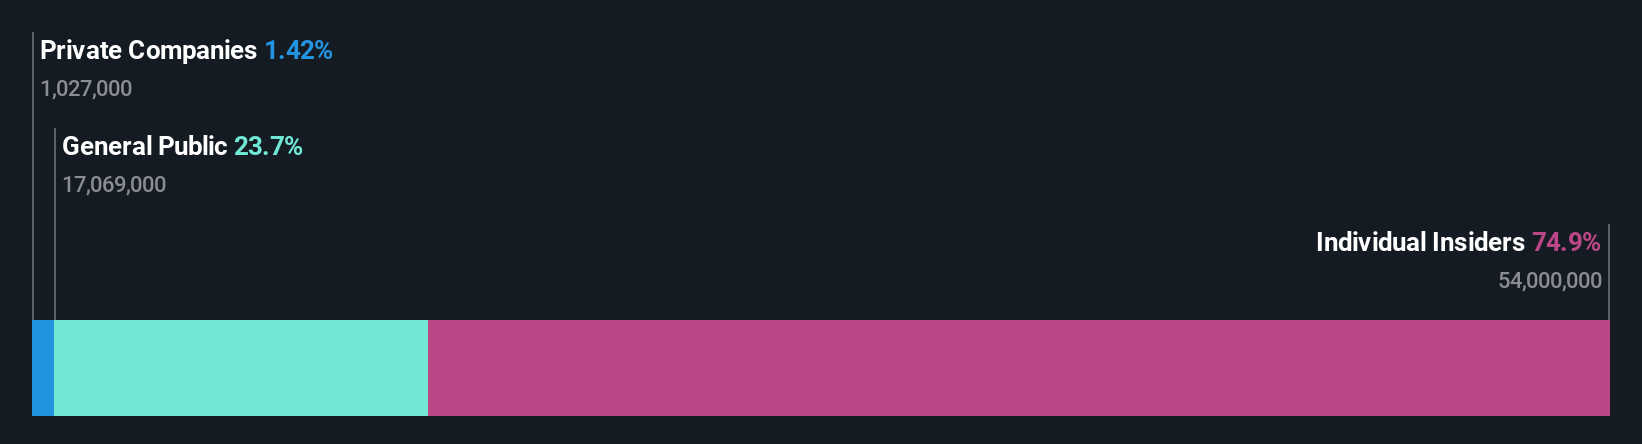
To get a sense of who is truly in control of Shanti Gold International Limited (NSE:SHANTIGOLD), it is important to understand the ownership structure of the business. The group holding the most number of shares in the company, around 75% to be precise, is individual insiders. That is, the group stands to benefit the most if the stock rises (or lose the most if there is a downturn).
As a result, insiders were the biggest beneficiaries of last week’s 17% gain.
Let's delve deeper into each type of owner of Shanti Gold International, beginning with the chart below.
View our latest analysis for Shanti Gold International
What Does The Lack Of Institutional Ownership Tell Us About Shanti Gold International?
Institutional investors often avoid companies that are too small, too illiquid or too risky for their tastes. But it's unusual to see larger companies without any institutional investors.
There are many reasons why a company might not have any institutions on the share registry. It may be hard for institutions to buy large amounts of shares, if liquidity (the amount of shares traded each day) is low. If the company has not needed to raise capital, institutions might lack the opportunity to build a position. On the other hand, it's always possible that professional investors are avoiding a company because they don't think it's the best place for their money. Shanti Gold International might not have the sort of past performance institutions are looking for, or perhaps they simply have not studied the business closely.

We note that hedge funds don't have a meaningful investment in Shanti Gold International. Looking at our data, we can see that the largest shareholder is the CEO Pankajkumar Jagawat with 37% of shares outstanding. In comparison, the second and third largest shareholders hold about 37% and 1.4% of the stock. Interestingly, the second-largest shareholder, Manojkumar Jain is also Top Key Executive, again, pointing towards strong insider ownership amongst the company's top shareholders.
To make our study more interesting, we found that the top 2 shareholders have a majority ownership in the company, meaning that they are powerful enough to influence the decisions of the company.
While it makes sense to study institutional ownership data for a company, it also makes sense to study analyst sentiments to know which way the wind is blowing. While there is some analyst coverage, the company is probably not widely covered. So it could gain more attention, down the track.
Insider Ownership Of Shanti Gold International
The definition of company insiders can be subjective and does vary between jurisdictions. Our data reflects individual insiders, capturing board members at the very least. Management ultimately answers to the board. However, it is not uncommon for managers to be executive board members, especially if they are a founder or the CEO.
Insider ownership is positive when it signals leadership are thinking like the true owners of the company. However, high insider ownership can also give immense power to a small group within the company. This can be negative in some circumstances.
Our information suggests that insiders own more than half of Shanti Gold International Limited. This gives them effective control of the company. That means they own ₹12b worth of shares in the ₹16b company. That's quite meaningful. Most would argue this is a positive, showing strong alignment with shareholders. You can click here to see if those insiders have been buying or selling.
General Public Ownership
The general public-- including retail investors -- own 24% stake in the company, and hence can't easily be ignored. While this group can't necessarily call the shots, it can certainly have a real influence on how the company is run.
Next Steps:
I find it very interesting to look at who exactly owns a company. But to truly gain insight, we need to consider other information, too. Take risks for example - Shanti Gold International has 1 warning sign we think you should be aware of.
Ultimately the future is most important. You can access this free report on analyst forecasts for the company.
NB: Figures in this article are calculated using data from the last twelve months, which refer to the 12-month period ending on the last date of the month the financial statement is dated. This may not be consistent with full year annual report figures.
Have feedback on this article? Concerned about the content? Get in touch with us directly. Alternatively, email editorial-team (at) simplywallst.com.
This article by Simply Wall St is general in nature. We provide commentary based on historical data and analyst forecasts only using an unbiased methodology and our articles are not intended to be financial advice. It does not constitute a recommendation to buy or sell any stock, and does not take account of your objectives, or your financial situation. We aim to bring you long-term focused analysis driven by fundamental data. Note that our analysis may not factor in the latest price-sensitive company announcements or qualitative material. Simply Wall St has no position in any stocks mentioned.