
- PREMIUM
- LIVE QUOTES
- INSTITUTIONS
 Index Options
 State Street
 CME Group
 Nasdaq
 Cboe
Cboe TradingView
 Wall Street Journal
Does The Trade Desk (TTD) Offer Value After A 68% One‑Year Share Price Slump
- If you are wondering whether Trade Desk is attractively priced or just a story stock at this point, starting with a clear look at value can help you set expectations before making any decisions.
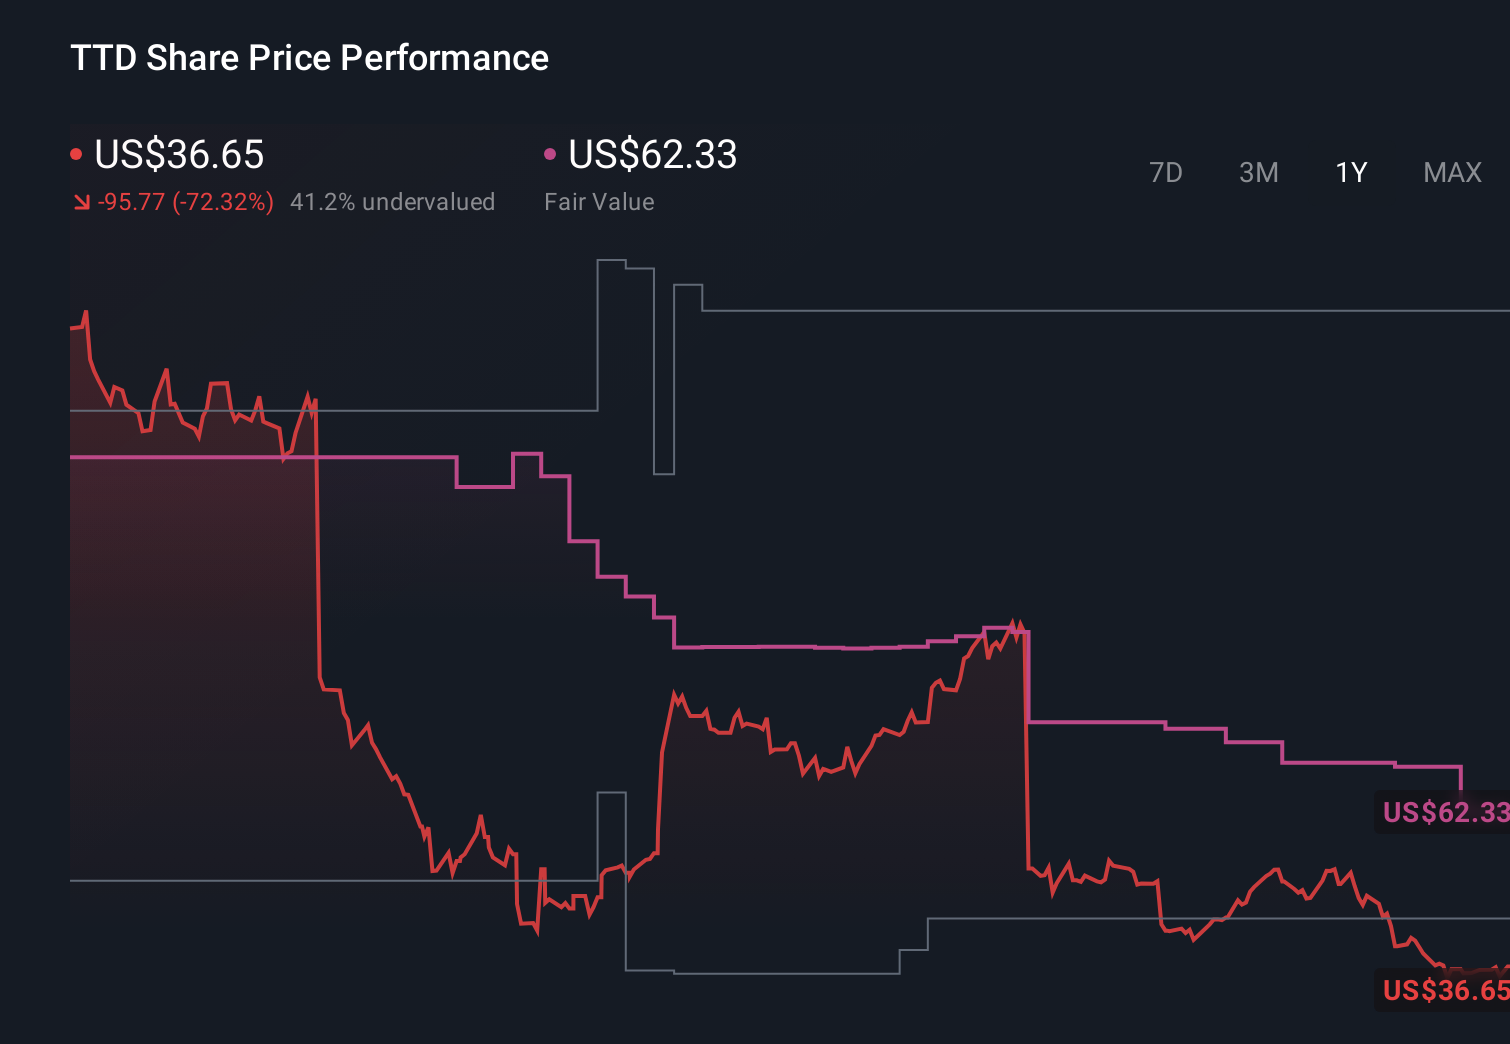
- The shares last closed at US$38.65, with a 1.8% gain over the past 7 days, a 1.8% decline over 30 days, a 2.6% return year to date, and a 68.2% decline over the past year. These moves may have changed how investors see both its potential and its risks.
- Recent attention on Trade Desk has focused on how the business fits into longer term trends in digital advertising and programmatic ad buying, along with how it is positioned against other ad tech platforms. These themes have framed much of the debate around whether the current share price reflects the company's prospects or embeds a cautious view.
- On our checks, Trade Desk scores 2 out of 6 on valuation value_score: 2/6. This suggests some measures point to potential undervaluation while others do not. Next we will walk through the main valuation approaches, then finish with a way of looking at value that brings these methods together more clearly.
Trade Desk scores just 2/6 on our valuation checks. See what other red flags we found in the full valuation breakdown.
Approach 1: Trade Desk Discounted Cash Flow (DCF) Analysis
A Discounted Cash Flow, or DCF, model takes estimates of the cash a company could generate in the future and discounts those cash flows back to today, aiming to translate a long stream of future cash into a single present value per share.
For Trade Desk, the model used is a 2 Stage Free Cash Flow to Equity approach based on cash flow projections. The company’s latest twelve month free cash flow is about $722.5 million. Analyst and extrapolated estimates see free cash flow reaching about $1.70 billion by 2030, with interim projections such as $913.8 million in 2026 and $1.38 billion in 2029, all in dollar terms and then discounted back to today.
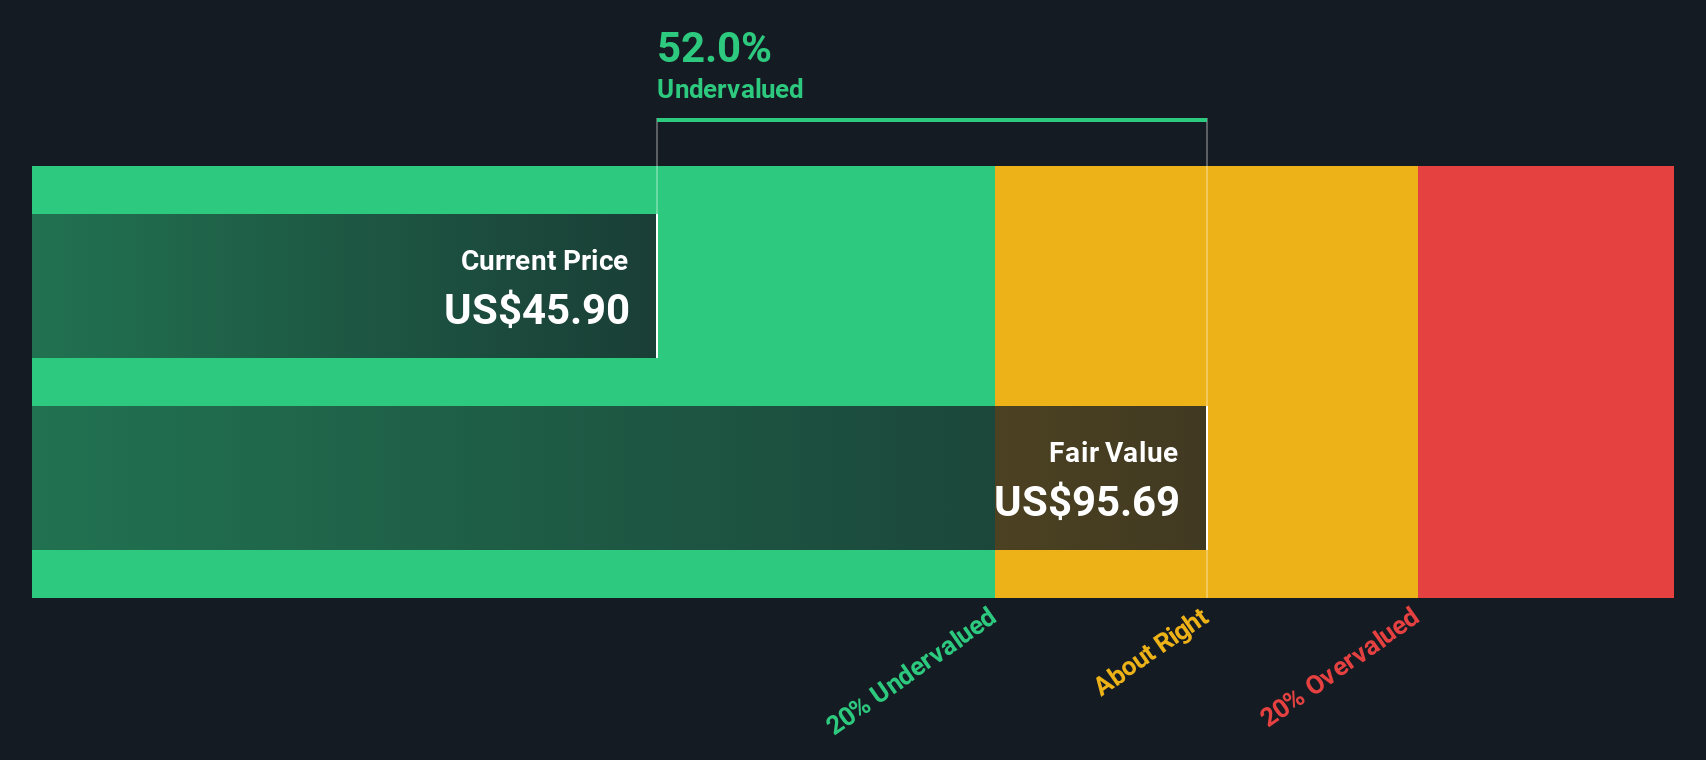
Pulling these discounted figures together, the DCF output suggests an estimated intrinsic value of about $98.99 per share, compared with the recent share price of $38.65. That implied gap corresponds to an intrinsic discount of roughly 61.0%, which indicates the model views Trade Desk as undervalued relative to its projected cash flows.
Result: UNDERVALUED
Our Discounted Cash Flow (DCF) analysis suggests Trade Desk is undervalued by 61.0%. Track this in your watchlist or portfolio, or discover 885 more undervalued stocks based on cash flows.
Approach 2: Trade Desk Price vs Earnings
For profitable companies, the P/E ratio is a useful way to link what you pay for each share to the earnings that the business is already generating. It gives you a simple "price tag per dollar of earnings" that you can compare across time and against other businesses.
What counts as a normal or fair P/E usually reflects how the market views a company’s growth potential and risk. Higher expected growth and lower perceived risk can support a higher P/E, while lower growth or higher risk tend to line up with a lower multiple.
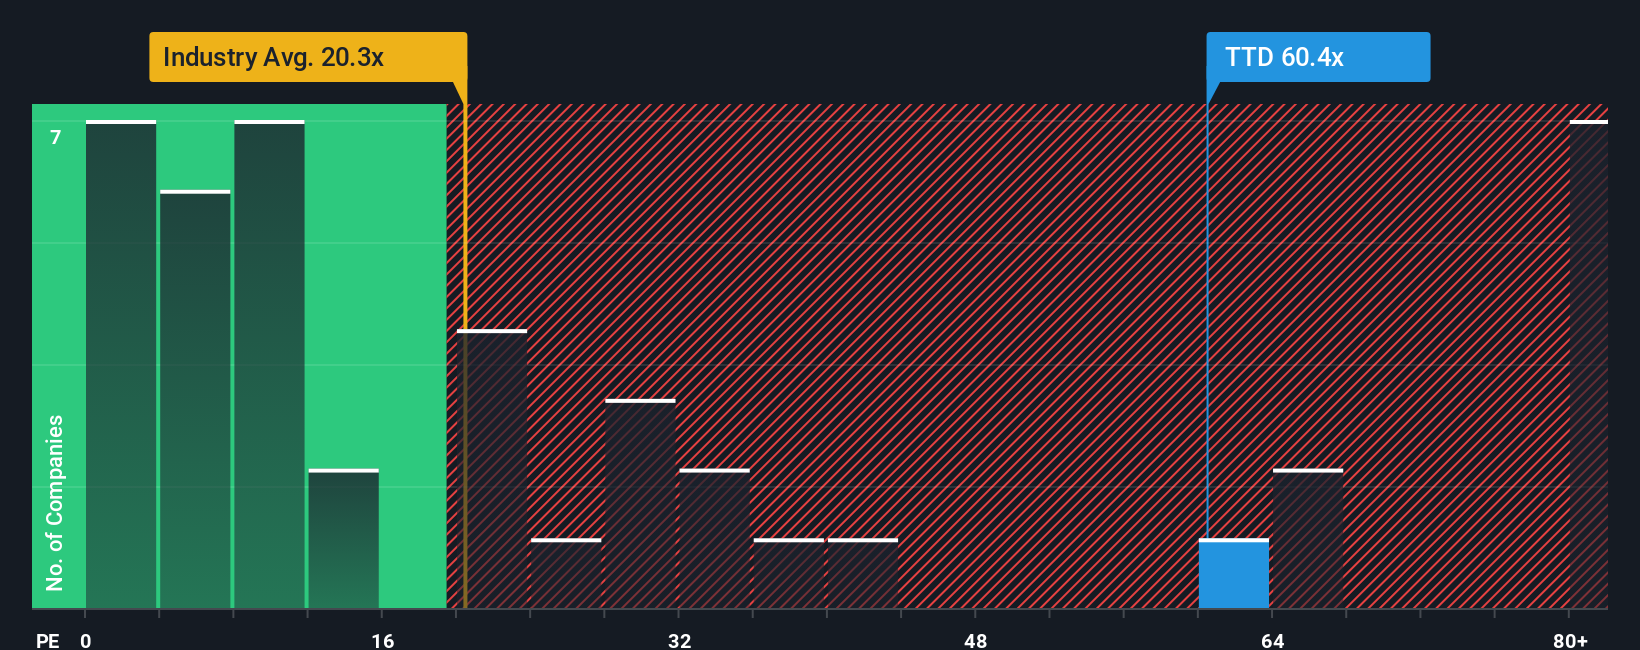
Trade Desk currently trades on a P/E of 42.62x. That sits well above the Media industry average of 14.60x and also above its peer group average of 40.58x, so on simple comparisons the shares carry a premium. Simply Wall St’s Fair Ratio for Trade Desk is 28.02x. This proprietary figure aims to estimate a suitable P/E given factors such as earnings growth, industry, profit margins, company size and risks, which can give a more tailored view than broad industry or peer benchmarks alone.
Comparing the Fair Ratio of 28.02x with the current P/E of 42.62x suggests the shares are trading at a richer level than this framework would imply.
Result: OVERVALUED
P/E ratios tell one story, but what if the real opportunity lies elsewhere? Discover 1449 companies where insiders are betting big on explosive growth.
Upgrade Your Decision Making: Choose your Trade Desk Narrative
Earlier we mentioned that there is an even better way to understand valuation, and on Simply Wall St this comes through Narratives. You set out your story for Trade Desk, link that story to explicit forecasts for revenue, earnings and margins, and end up with your own fair value that you can compare to the current price on the Community page used by millions of investors. Those Narratives update automatically when new news or earnings appear. For example, one Trade Desk investor might plug in assumptions close to the higher analyst fair value around US$135 per share, while another might anchor nearer the lower end around US$34 per share. Each can then decide how comfortable they are with that spread before making any buy or sell decisions.
Do you think there's more to the story for Trade Desk? Head over to our Community to see what others are saying!
This article by Simply Wall St is general in nature. We provide commentary based on historical data and analyst forecasts only using an unbiased methodology and our articles are not intended to be financial advice. It does not constitute a recommendation to buy or sell any stock, and does not take account of your objectives, or your financial situation. We aim to bring you long-term focused analysis driven by fundamental data. Note that our analysis may not factor in the latest price-sensitive company announcements or qualitative material. Simply Wall St has no position in any stocks mentioned.
Have feedback on this article? Concerned about the content? Get in touch with us directly. Alternatively, email editorial-team@simplywallst.com