
- PREMIUM
- LIVE QUOTES
- INSTITUTIONS
 Index Options
 State Street
 CME Group
 Nasdaq
 Cboe
Cboe TradingView
 Wall Street Journal
Is It Time To Reassess Mid-America Apartment Communities (MAA) After Recent Share Price Weakness?
- If you are wondering whether Mid-America Apartment Communities is attractively priced today, this article walks through what the current share price might be implying about value.
- The stock closed at US$134.98, with a 7 day return of 2.8% decline, a 30 day return of 3.0% and a year to date return of 3.0% decline, while the 1 year return sits at 5.8% decline and the 3 year return at 5.1% decline, compared with a 5 year return of 27.0%.
- Recent price moves have come alongside ongoing investor interest in listed residential REITs and in how resilient rental housing assets may be through different parts of the cycle. That backdrop is shaping how the market is thinking about both risk and potential reward for Mid-America Apartment Communities.
- On our framework the company scores 3 out of 6 valuation checks as undervalued. Next we will walk through what different valuation approaches say about the stock, before finishing with a simple way to pull those methods together into a clearer view of value.
Approach 1: Mid-America Apartment Communities Discounted Cash Flow (DCF) Analysis
A Discounted Cash Flow model estimates what a company might be worth by projecting its future adjusted funds from operations and then discounting those cash flows back to today, using a required rate of return.
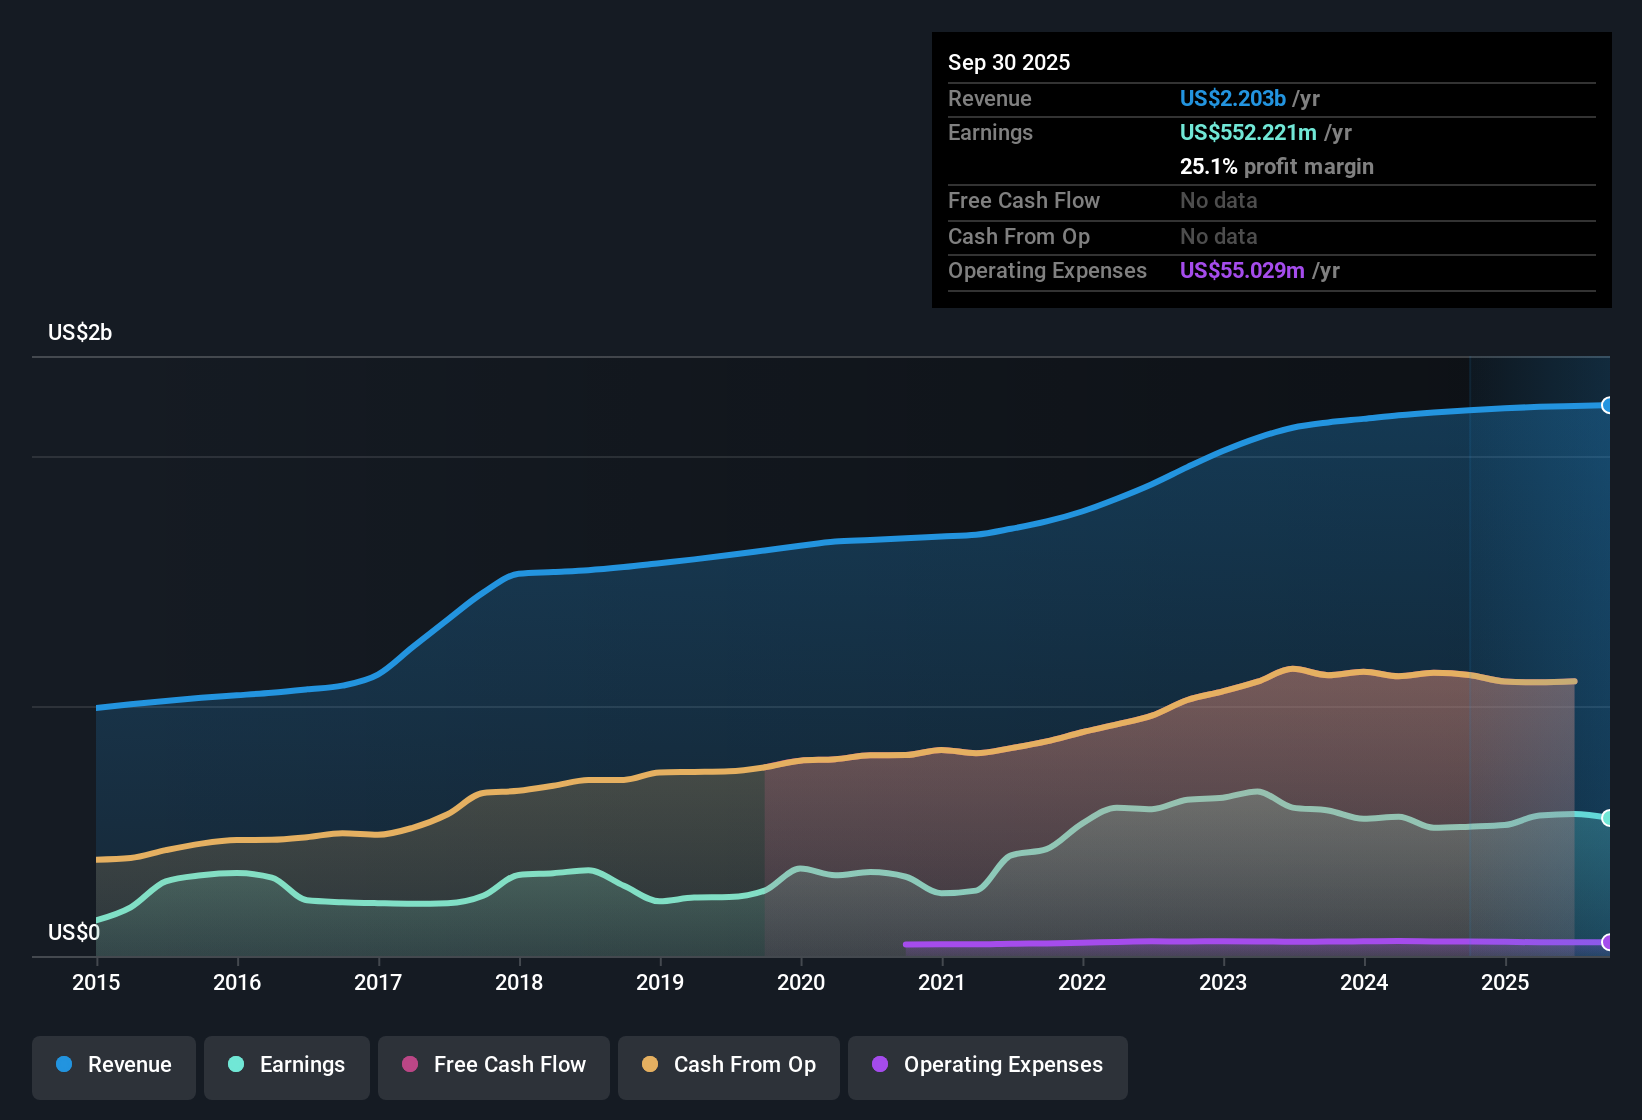
For Mid-America Apartment Communities, the model uses a 2 stage Free Cash Flow to Equity approach based on adjusted funds from operations. The latest twelve month free cash flow is about $952.76 million. Analysts provide explicit forecasts for the early years, and Simply Wall St then extrapolates further out. On this basis, projected free cash flow for 2030 is $1,047.31 million, with a full set of discounted cash flows running through 2035.
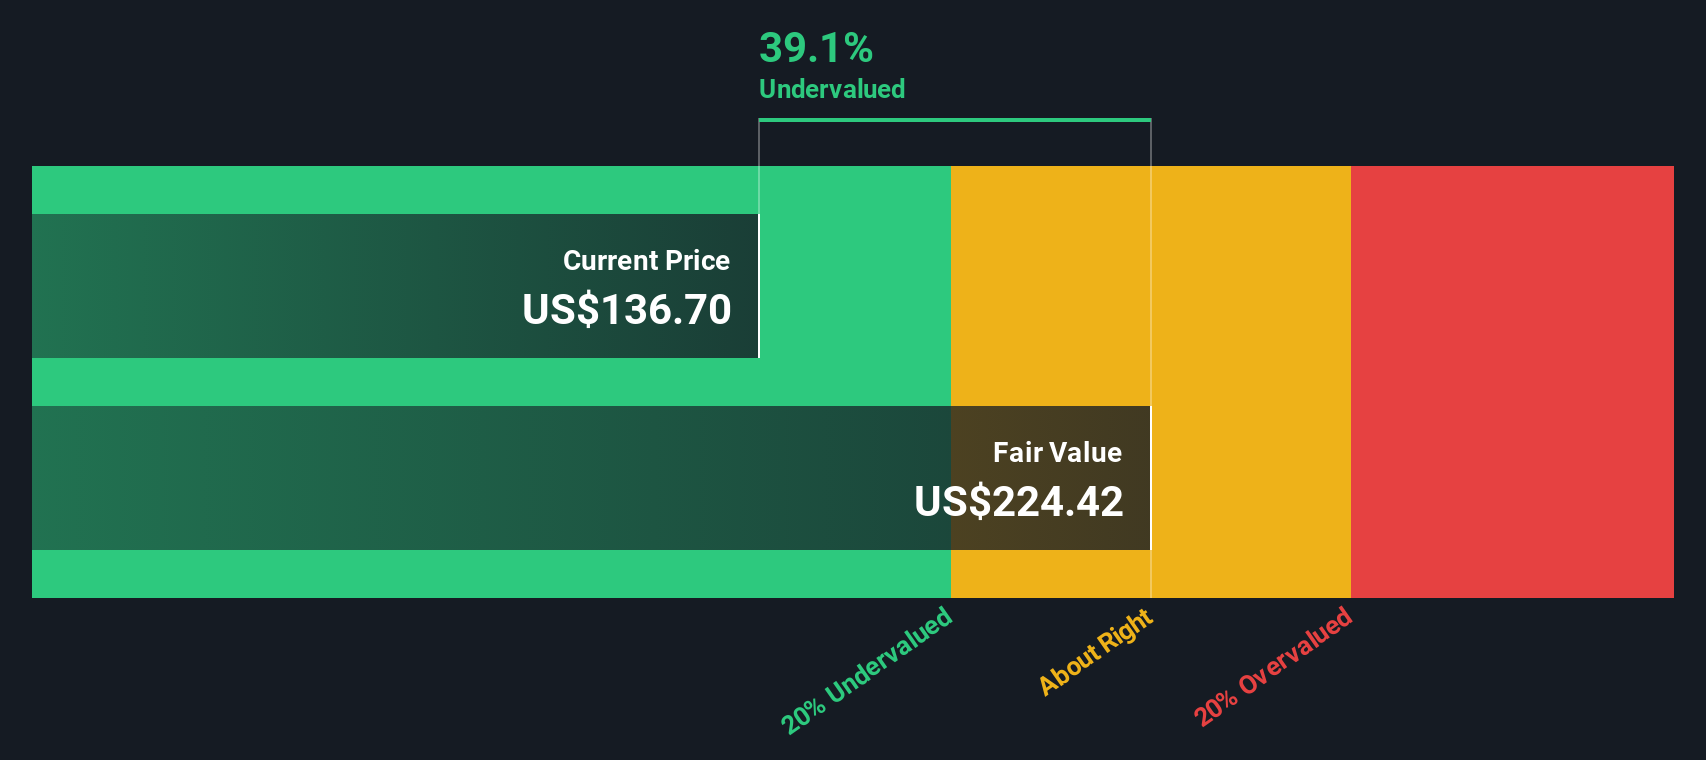
When all those future cash flows are discounted back, the estimated intrinsic value is about $196.55 per share. Compared with the recent share price of $134.98, the DCF indicates an implied discount of 31.3%, which means the stock screens as undervalued according to this model.
Result: UNDERVALUED
Our Discounted Cash Flow (DCF) analysis suggests Mid-America Apartment Communities is undervalued by 31.3%. Track this in your watchlist or portfolio, or discover 885 more undervalued stocks based on cash flows.
Approach 2: Mid-America Apartment Communities Price vs Earnings
For profitable companies, the P/E ratio is a useful way to think about value because it links what you are paying directly to the earnings the business is generating today.
What counts as a "normal" or "fair" P/E often reflects how the market views a company’s growth potential and risk profile. Higher expected growth or lower perceived risk can line up with a higher P/E, while slower growth or higher risk can line up with a lower P/E.
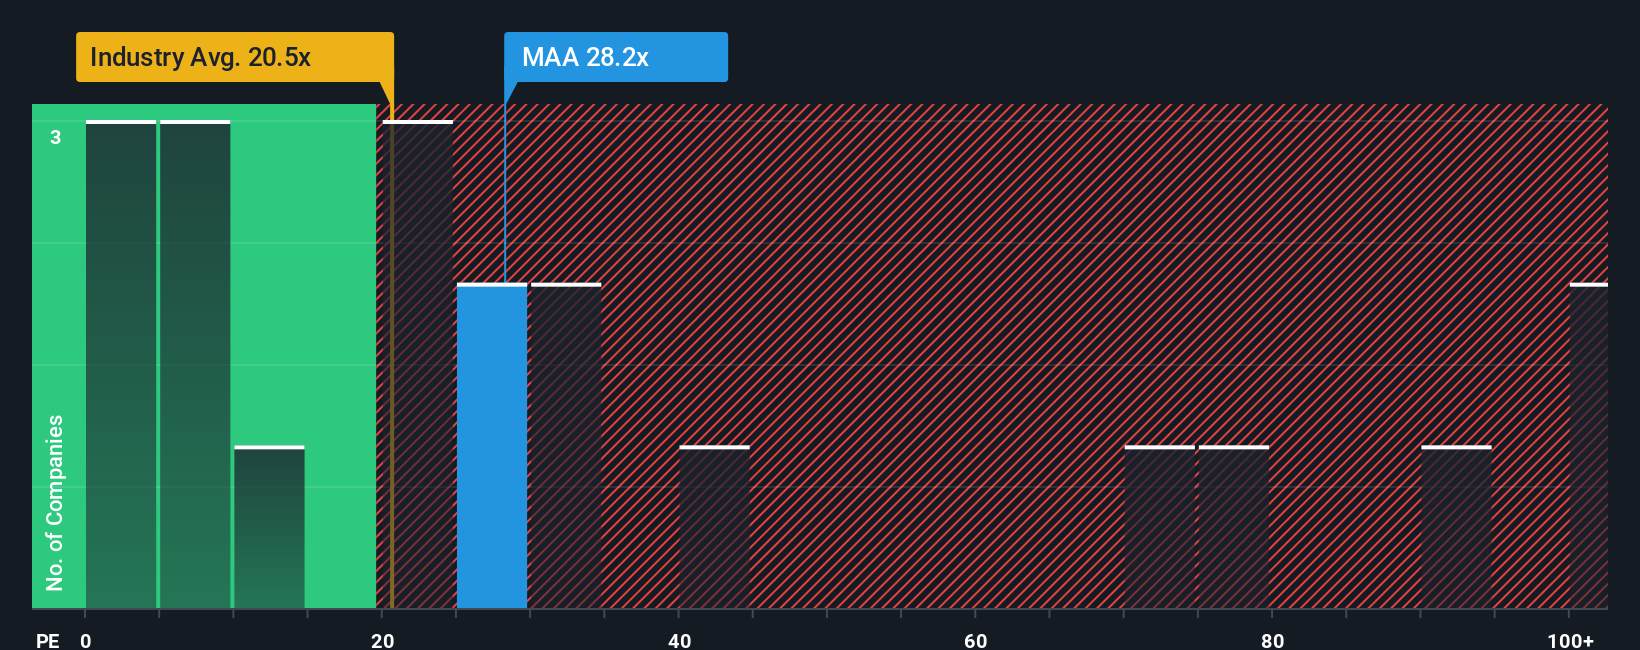
Mid-America Apartment Communities currently trades on a P/E of 28.62x. That sits above the Residential REITs industry average P/E of 20.55x, but below the peer group average of 41.58x. Simply Wall St’s Fair Ratio for the stock is 27.41x, which is its estimate of what a balanced P/E might look like once you factor in elements such as earnings growth, industry, profit margins, market cap and company specific risks.
The Fair Ratio aims to be more tailored than a simple comparison with industry or peers because it blends those business characteristics into a single benchmark. With the actual P/E of 28.62x sitting slightly above the Fair Ratio of 27.41x, the shares screen as overvalued on this measure.
Result: OVERVALUED
P/E ratios tell one story, but what if the real opportunity lies elsewhere? Discover 1449 companies where insiders are betting big on explosive growth.
Upgrade Your Decision Making: Choose your Mid-America Apartment Communities Narrative
Earlier we mentioned that there is an even better way to understand valuation. Let us introduce you to Narratives, a simple tool on Simply Wall St’s Community page. You can connect your view of Mid-America Apartment Communities, including assumptions such as revenue reaching about US$2.5b, earnings of US$488.4 million and a future P/E of 48.6x, to a financial forecast and a fair value. You can then compare that fair value to the current price to help inform your investment decision. The Narrative automatically updates as new news, earnings or guidance arrives. This means that two investors can reasonably hold very different fair values, for example one closer to the higher analyst target of US$176 and another nearer the lower US$142 target, based on how each weighs Sunbelt demand, supply risks, margins and required returns.
Do you think there's more to the story for Mid-America Apartment Communities? Head over to our Community to see what others are saying!
This article by Simply Wall St is general in nature. We provide commentary based on historical data and analyst forecasts only using an unbiased methodology and our articles are not intended to be financial advice. It does not constitute a recommendation to buy or sell any stock, and does not take account of your objectives, or your financial situation. We aim to bring you long-term focused analysis driven by fundamental data. Note that our analysis may not factor in the latest price-sensitive company announcements or qualitative material. Simply Wall St has no position in any stocks mentioned.
Have feedback on this article? Concerned about the content? Get in touch with us directly. Alternatively, email editorial-team@simplywallst.com