
- PREMIUM
- LIVE QUOTES
- INSTITUTIONS
 Index Options
 State Street
 CME Group
 Nasdaq
 Cboe
Cboe TradingView
 Wall Street Journal
Is Protagonist Therapeutics (PTGX) Still Attractive After Recent Share Price Volatility
- Wondering whether Protagonist Therapeutics at around US$82 per share is still offering value, or if the best part of the opportunity has passed? This article is aimed at helping you frame that question clearly.
- The stock has been volatile in the short term, with a 5.8% decline over the last week and an 8.9% decline over the last month, even though the 1 year return stands at 118.6% and the 5 year return at 285.6%.
- These sharp moves come against a backdrop of ongoing interest in Protagonist Therapeutics' pipeline and broader sector attention on higher risk, higher reward biotech names. This can quickly change how investors think about risk and potential upside. While the short term price swings are front of mind, many investors are mainly asking whether the current share price fairly reflects the company's prospects.
- On Simply Wall St's valuation checks, Protagonist Therapeutics scores 2 out of 6, as it is assessed to be undervalued on 2 of the 6 measures, and you can see the breakdown in the valuation score. Next we will look at how different valuation approaches assess the stock today, before finishing with an even more practical way to think about what "fair value" really means for you.
Protagonist Therapeutics scores just 2/6 on our valuation checks. See what other red flags we found in the full valuation breakdown.
Approach 1: Protagonist Therapeutics Discounted Cash Flow (DCF) Analysis
A Discounted Cash Flow model takes estimates of the cash a business could generate in the future and discounts those back to what they might be worth in today’s dollars. It is essentially asking what a stream of future cash flows might be worth if you had to pay for it now.
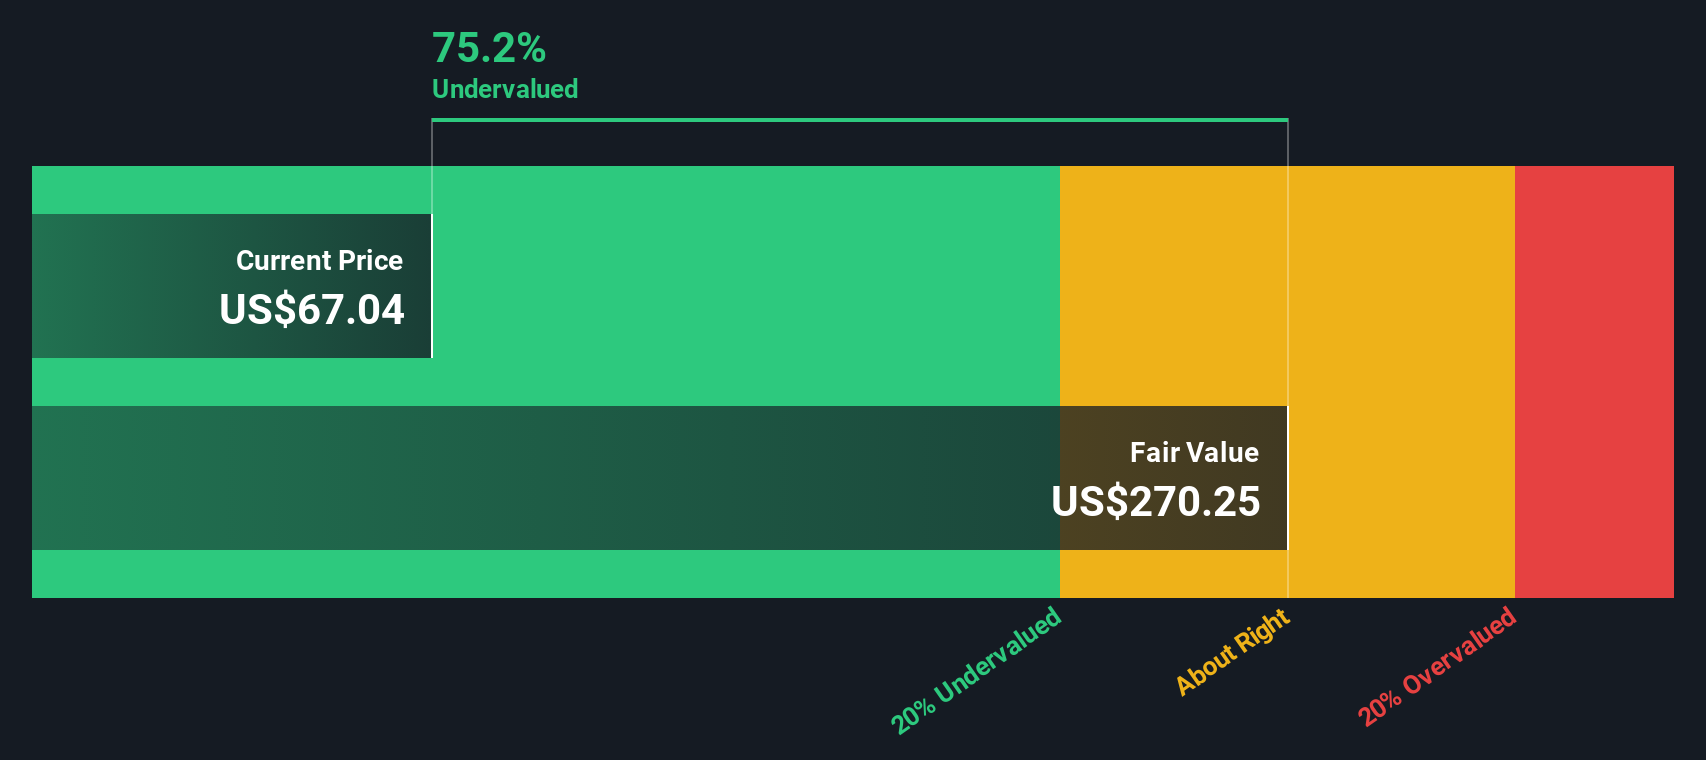
For Protagonist Therapeutics, the model used is a 2 Stage Free Cash Flow to Equity approach, based on cash flows in $. The latest twelve month free cash flow is about $64.1 million. Analysts provide explicit projections up to 2030, such as $170 million in 2026 and $370 million in 2030. Further annual figures after that are extrapolated by Simply Wall St rather than coming from analyst reports.
Combining all of those projected and extrapolated cash flows, and discounting them back to today, produces an estimated intrinsic value of about $233.30 per share. Compared with a recent share price of around $82, this particular model indicates the stock is trading at a significant discount, with an implied difference of 64.7%.
Result: UNDERVALUED
Our Discounted Cash Flow (DCF) analysis suggests Protagonist Therapeutics is undervalued by 64.7%. Track this in your watchlist or portfolio, or discover 885 more undervalued stocks based on cash flows.
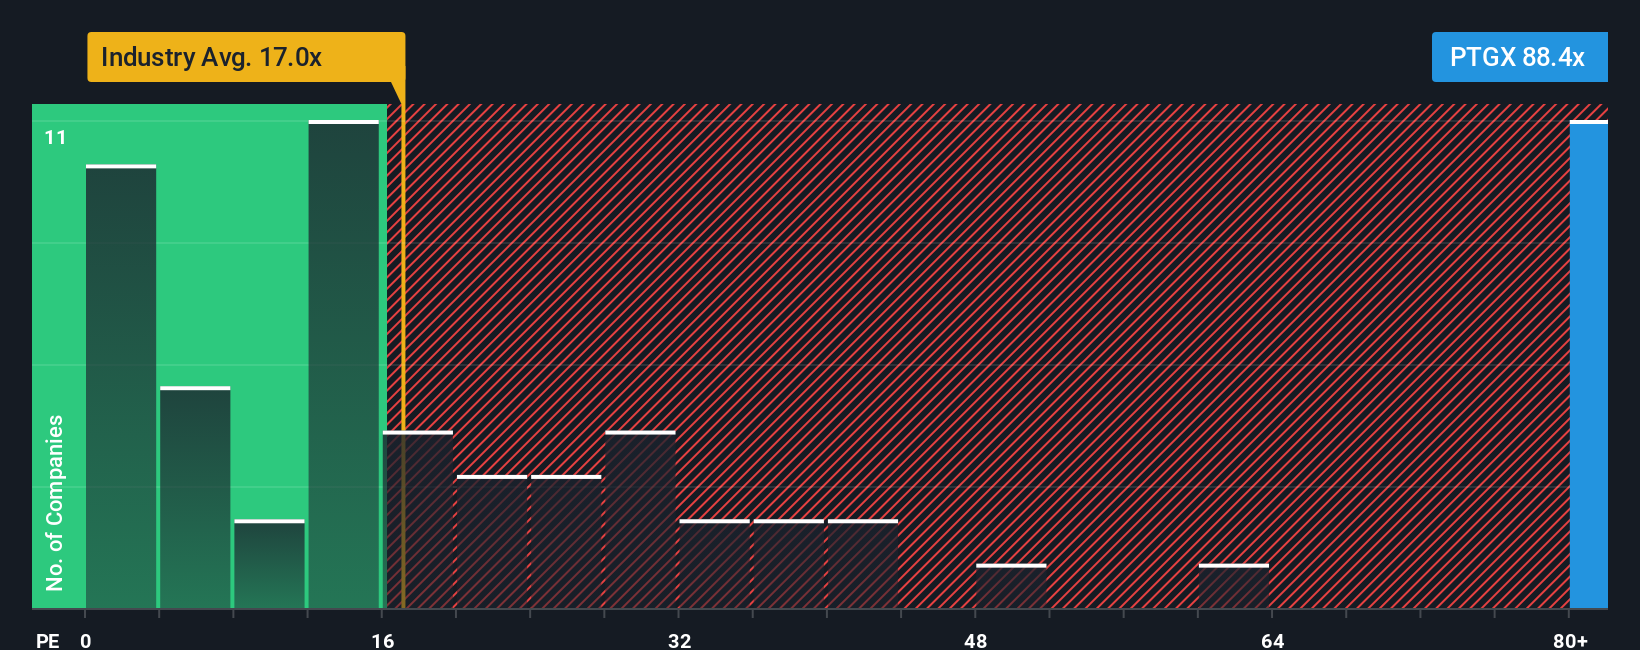
Approach 2: Protagonist Therapeutics Price vs Earnings
For profitable companies, the P/E ratio is a useful shorthand for how much investors are paying today for each dollar of current earnings. It links directly to what matters most to many shareholders, the relationship between the share price and the company’s profit.
A “normal” or “fair” P/E usually reflects what investors are willing to pay given their expectations for future earnings growth and the risks they see in the business. Higher expected growth and lower perceived risk can justify a higher P/E, while lower growth or higher risk tend to pull it down.
Protagonist Therapeutics is currently trading on a P/E of about 112.0x, compared with the Biotechs industry average of roughly 21.5x and a peer average of 28.5x. Simply Wall St’s “Fair Ratio” for Protagonist Therapeutics is 31.8x. This Fair Ratio is a proprietary estimate of what the P/E could be given factors such as earnings growth, profit margins, industry, market cap and company specific risks, which makes it more tailored than a simple comparison with peers or the broad industry.
Against that Fair Ratio of 31.8x, the current P/E of 112.0x suggests the stock is pricing in much richer expectations than those inputs imply.
Result: OVERVALUED
P/E ratios tell one story, but what if the real opportunity lies elsewhere? Discover 1450 companies where insiders are betting big on explosive growth.
Upgrade Your Decision Making: Choose your Protagonist Therapeutics Narrative
Earlier we mentioned that there is an even better way to understand valuation, so let us introduce you to Narratives, a simple way for you to write the story behind your numbers by linking your view on Protagonist Therapeutics to your own assumptions for future revenue, earnings and margins. These then flow into a financial forecast and a fair value that you can compare to today’s share price.
On Simply Wall St’s Community page, millions of investors use Narratives as an easy tool to set their fair value, see it side by side with the current market price and quickly judge whether a stock looks cheap enough to consider buying or fully priced and therefore one they might hold off on or think about selling.
Narratives are also kept up to date as fresh information like news or earnings comes in, so your forecast and fair value can move with the story rather than staying frozen in time.
For example, with Protagonist Therapeutics one investor might publish a Narrative with a very optimistic fair value and strong future revenue growth assumptions, while another opts for a much lower fair value and more cautious revenue growth, reflecting how differently people can interpret the same company.
Do you think there's more to the story for Protagonist Therapeutics? Head over to our Community to see what others are saying!

This article by Simply Wall St is general in nature. We provide commentary based on historical data and analyst forecasts only using an unbiased methodology and our articles are not intended to be financial advice. It does not constitute a recommendation to buy or sell any stock, and does not take account of your objectives, or your financial situation. We aim to bring you long-term focused analysis driven by fundamental data. Note that our analysis may not factor in the latest price-sensitive company announcements or qualitative material. Simply Wall St has no position in any stocks mentioned.
Have feedback on this article? Concerned about the content? Get in touch with us directly. Alternatively, email editorial-team@simplywallst.com