
- PREMIUM
- LIVE QUOTES
- INSTITUTIONS
 Index Options
 State Street
 CME Group
 Nasdaq
 Cboe
Cboe TradingView
 Wall Street Journal
Assessing OR Royalties’ Valuation After Record 2025 Revenues Share Buybacks And Debt Repayment
What triggered fresh interest in OR Royalties?
OR Royalties (TSX:OR) is back on investors’ radar after reporting record preliminary revenues from royalties and streams for both the fourth quarter and full year 2025, while meeting its gold equivalent ounce delivery guidance.
See our latest analysis for OR Royalties.
The record royalty revenues, full repayment of the revolving credit facility, and C$50.8 million share buyback appear to align with building momentum. The 30 day share price return of 8.33%, a 90 day share price decline of 10.52%, and a 1 year total shareholder return of 92.72% highlight how strong the longer term picture has been.
If this kind of rerating story interests you, it might be worth widening the lens and checking out fast growing stocks with high insider ownership as potential next ideas.
With record royalty revenues, double digit annual revenue and net income growth, and the stock trading at what appears to be roughly an 18% intrinsic discount, the key question now is whether OR Royalties is still undervalued or if the market is already pricing in future growth.
Price-to-Earnings of 46.8x: Is it justified?
OR Royalties last closed at CA$50.87, and on a P/E of 46.8x it is priced well above both its peer group and the wider Canadian metals and mining industry.
The P/E ratio compares the current share price to earnings per share and is a common way investors think about how much they are paying for each dollar of profit. For a royalty and streaming business like OR Royalties, that multiple reflects what the market is willing to pay for its current earnings profile and the profit growth that analysts expect.
According to the Simply Wall St fair ratio work, OR Royalties P/E of 46.8x is high relative to an estimated fair P/E of 22.7x. The current price therefore implies a richer earnings multiple than that model suggests. Analysts also expect earnings to grow 19.7% per year and revenue 18.6% per year, which may help explain why the market is currently paying a premium to those fair value indications.
Against the Canadian metals and mining industry average P/E of 23.2x and a peer average of 24.7x, OR Royalties 46.8x stands out as significantly more expensive. This implies investors are paying roughly double the sector and peer earnings multiples for this stock.
Explore the SWS fair ratio for OR Royalties
Result: Price-to-Earnings of 46.8x (OVERVALUED)
However, that premium P/E multiple could be tested if revenue or net income growth of around 19% slows, or if sentiment toward precious metals weakens.
Find out about the key risks to this OR Royalties narrative.
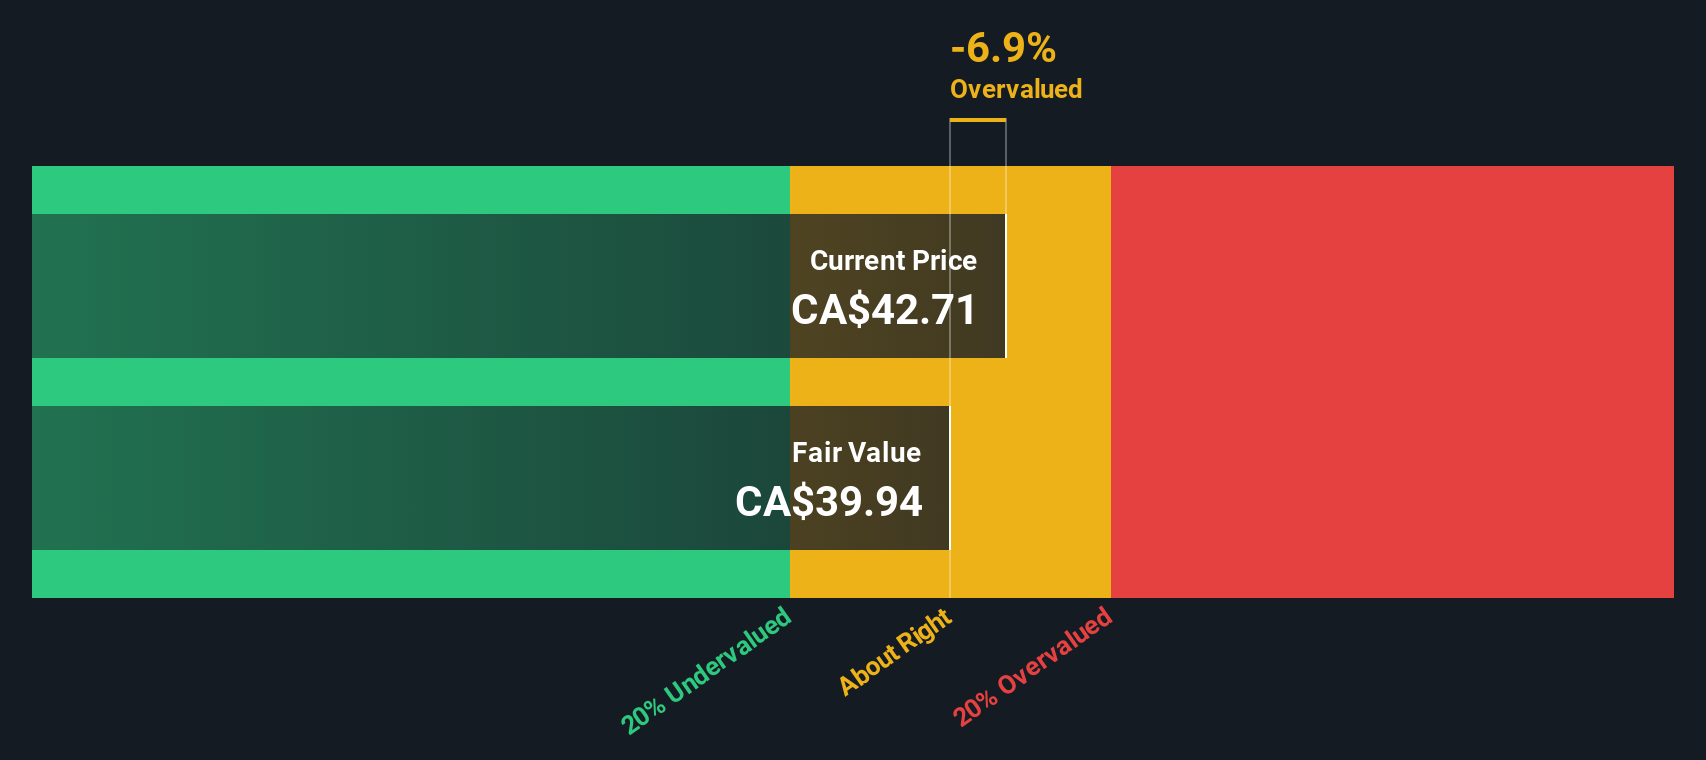
Another view on value
Our DCF model points in the opposite direction to the high P/E. On this approach, OR Royalties at CA$50.87 is trading about 17.6% below an estimated fair value of CA$61.76. One model indicates the stock may be expensive; the other suggests it may be discounted. Which approach do you consider more useful for your own process?
Look into how the SWS DCF model arrives at its fair value.
Simply Wall St performs a discounted cash flow (DCF) on every stock in the world every day (check out OR Royalties for example). We show the entire calculation in full. You can track the result in your watchlist or portfolio and be alerted when this changes, or use our stock screener to discover 877 undervalued stocks based on their cash flows. If you save a screener we even alert you when new companies match - so you never miss a potential opportunity.
Build Your Own OR Royalties Narrative
If you see the numbers differently or want to stress test your own view, you can pull the data, shape your thesis, and Do it your way in just a few minutes.
A great starting point for your OR Royalties research is our analysis highlighting 4 key rewards and 1 important warning sign that could impact your investment decision.
Looking for more investment ideas?
If you are serious about building a stronger portfolio, do not stop at one stock. The right mix of ideas can make a real difference over time.
- Spot potential value by scanning these 877 undervalued stocks based on cash flows that currently trade at prices the market might not fully appreciate.
- Tap into growth themes through these 26 AI penny stocks that sit at the center of artificial intelligence adoption.
- Strengthen your income stream with these 11 dividend stocks with yields > 3% that already offer yields above 3%.
This article by Simply Wall St is general in nature. We provide commentary based on historical data and analyst forecasts only using an unbiased methodology and our articles are not intended to be financial advice. It does not constitute a recommendation to buy or sell any stock, and does not take account of your objectives, or your financial situation. We aim to bring you long-term focused analysis driven by fundamental data. Note that our analysis may not factor in the latest price-sensitive company announcements or qualitative material. Simply Wall St has no position in any stocks mentioned.
Have feedback on this article? Concerned about the content? Get in touch with us directly. Alternatively, email editorial-team@simplywallst.com