
- PREMIUM
- LIVE QUOTES
- INSTITUTIONS
 Index Options
 State Street
 CME Group
 Nasdaq
 Cboe
Cboe TradingView
 Wall Street Journal
Is There Still Value In Viasat (VSAT) After Its 350% One Year Surge?
- If you are wondering whether Viasat’s current share price reflects its true worth, you are not alone, many investors are asking the same question right now.
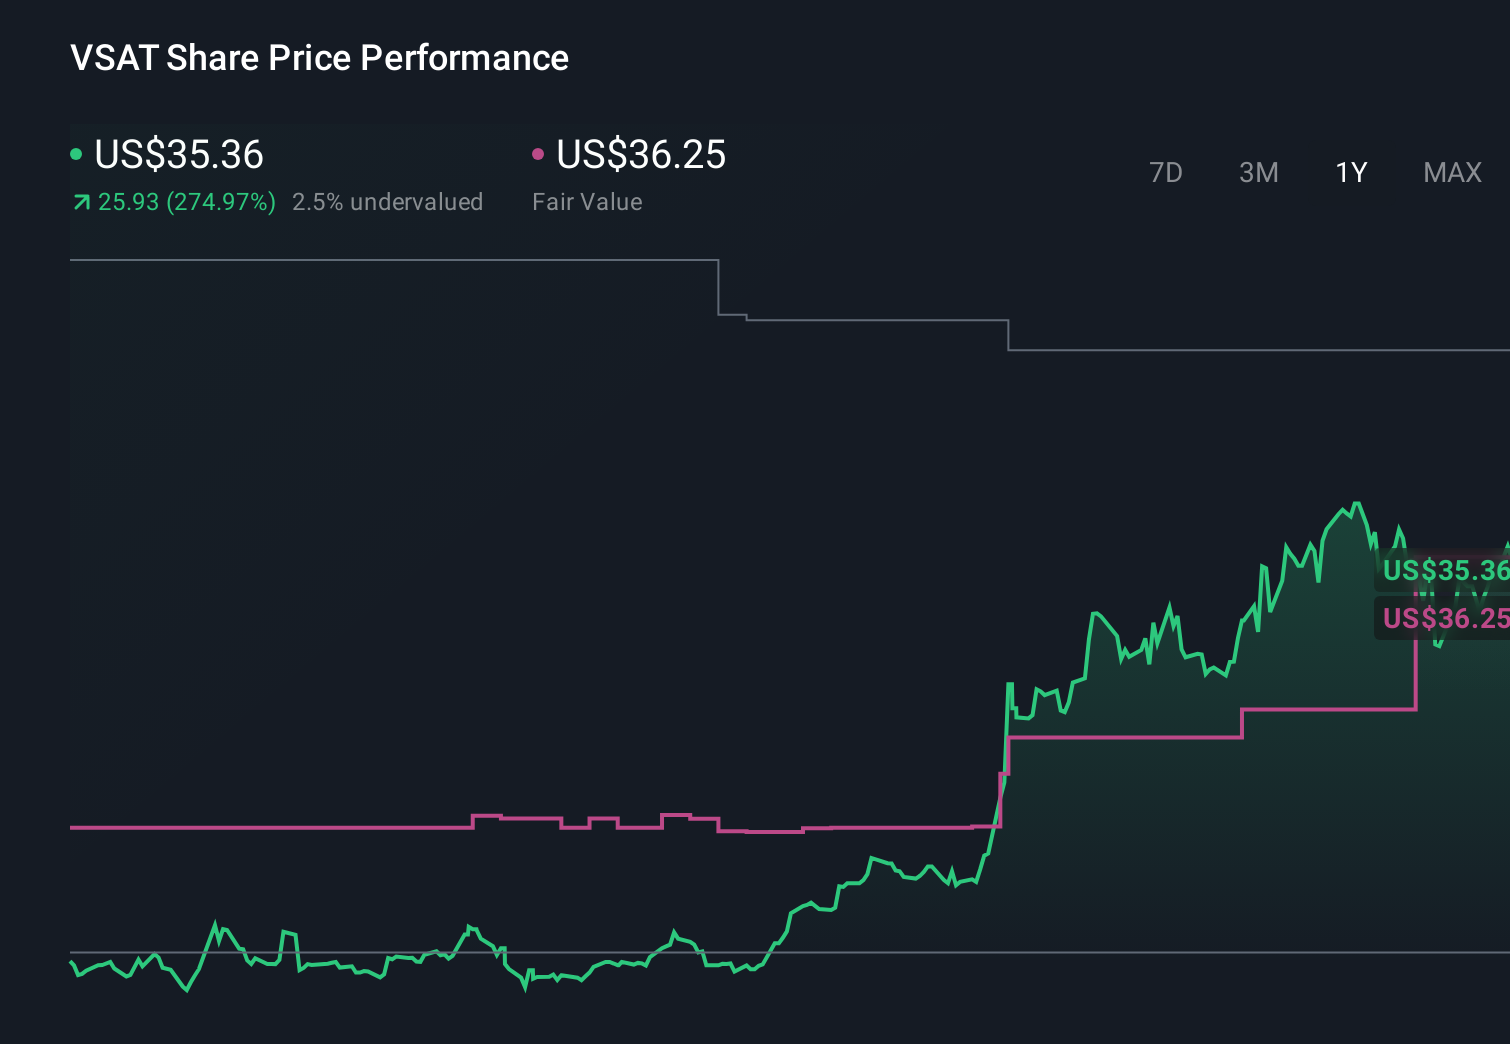
- The stock recently closed at US$43.46, with returns of 23.0% over 7 days, 24.3% over 30 days, 15.5% year to date and 349.9% over the past year.
- These moves have put Viasat back on the radar for investors who focus on how price lines up with fundamentals. The key question now is whether recent gains are already pricing in the latest developments or if there is still a gap between market price and underlying value.
- On our valuation checks Viasat scores 5 out of 6, giving it a value score of 5. Next we will compare what different valuation methods say about that pricing, then finish with a way of looking at value that can help you put all of those methods into context.
Approach 1: Viasat Discounted Cash Flow (DCF) Analysis
A Discounted Cash Flow, or DCF, model takes estimates of a company’s future cash flows and discounts them back to today, aiming to translate those future dollars into a single present value per share.
For Viasat, the model used is a 2 Stage Free Cash Flow to Equity approach. The latest twelve month free cash flow is a loss of about $265 million, so the story here hinges on what future cash flows might look like rather than current levels.
Analyst and model projections provided to Simply Wall St show free cash flow rising to about $12.1 million in 2026 and $573 million by the year ending March 2028, with further years extrapolated out to 2035. All of these projected figures are in US$, and values beyond the initial analyst horizon are model based estimates.
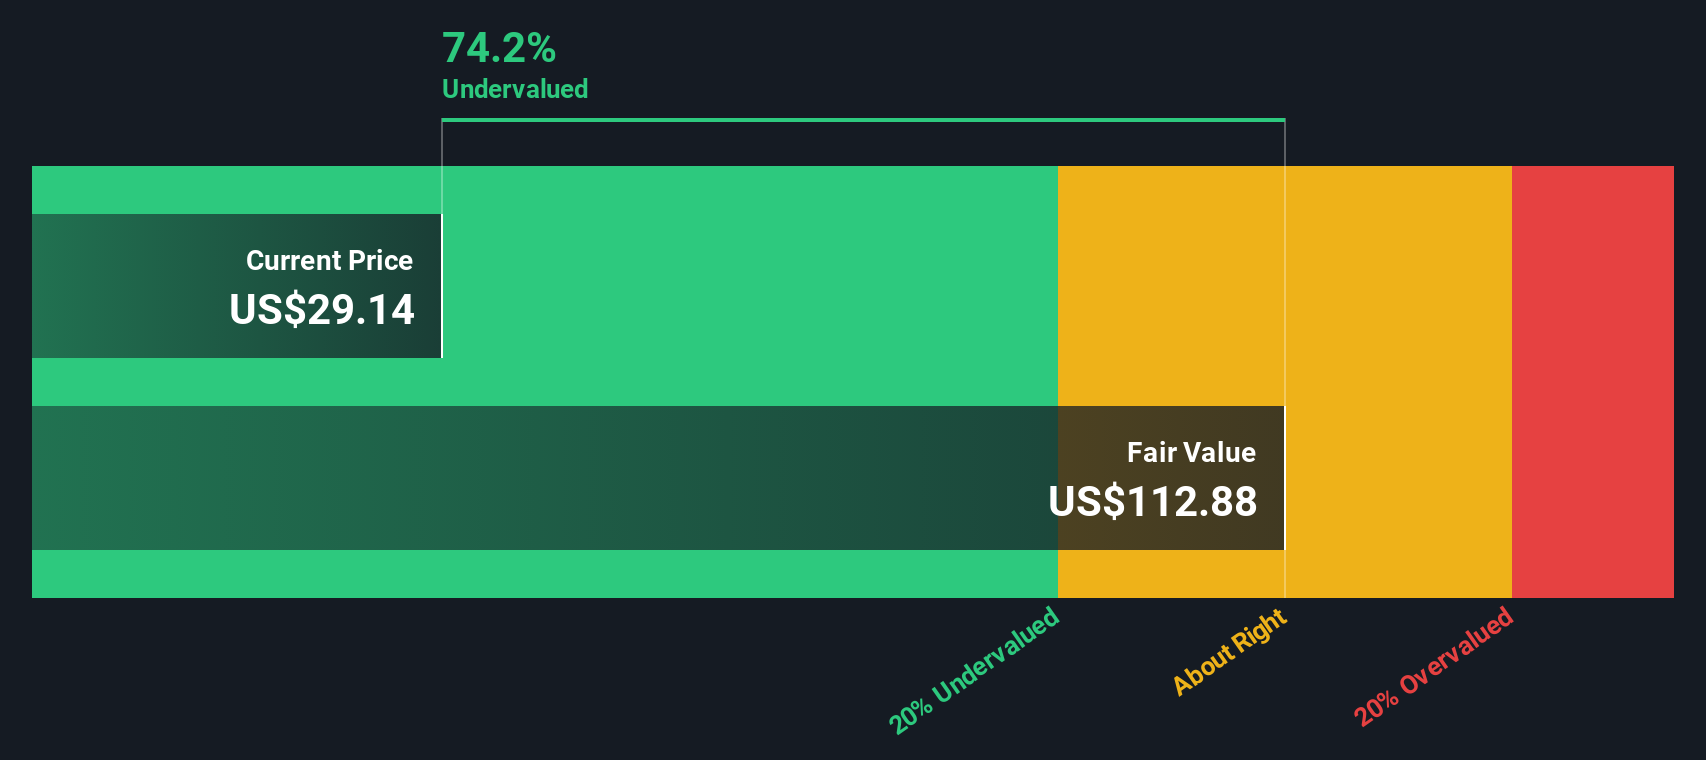
When those projected cash flows are discounted back and summed, the DCF model produces an estimated intrinsic value of about $107.24 per share. Compared with the recent price of $43.46, this implies the shares are about 59.5% undervalued under these assumptions.
Result: UNDERVALUED
Our Discounted Cash Flow (DCF) analysis suggests Viasat is undervalued by 59.5%. Track this in your watchlist or portfolio, or discover 877 more undervalued stocks based on cash flows.
Approach 2: Viasat Price vs Sales
For many profitable companies, P/S is a useful sense check because it compares what the market is paying against the revenue the business is already generating, without getting tangled up in short term swings in earnings or cash flow.
What counts as a “fair” P/S depends on how quickly revenue is expected to grow and how risky those future sales look. Higher growth and lower perceived risk can justify a higher multiple, while slower growth or higher risk usually call for a lower one.
Viasat is currently trading on a P/S of 1.28x. That sits below the Communications industry average of 2.17x and also below the peer group average of 3.64x. Simply Wall St’s Fair Ratio model, which estimates an appropriate P/S based on factors like earnings growth, profit margins, industry, market cap and risk, suggests a P/S of 1.73x for Viasat.
Because the Fair Ratio is tailored to the company’s specific profile rather than broad peer or industry comparisons, it can be a more targeted reference point. With the current 1.28x P/S below the 1.73x Fair Ratio, the multiple points to the shares looking undervalued on this approach.
Result: UNDERVALUED

P/S ratios tell one story, but what if the real opportunity lies elsewhere? Discover 1450 companies where insiders are betting big on explosive growth.
Upgrade Your Decision Making: Choose your Viasat Narrative
Earlier we mentioned that there is an even better way to understand valuation. On Simply Wall St’s Community page you can use Narratives to write your own story for Viasat. You can link what you believe about its satellites, competition and cash flows to specific forecasts for revenue, earnings and margins, then to a Fair Value you can compare with the current price. As new news or earnings are released, those Narratives update automatically. This is why one investor might build a more optimistic Viasat story that aligns with a Fair Value closer to the US$52 analyst target, while another might focus on the risks and anchor their Narrative near the US$10 target instead.
Do you think there's more to the story for Viasat? Head over to our Community to see what others are saying!
This article by Simply Wall St is general in nature. We provide commentary based on historical data and analyst forecasts only using an unbiased methodology and our articles are not intended to be financial advice. It does not constitute a recommendation to buy or sell any stock, and does not take account of your objectives, or your financial situation. We aim to bring you long-term focused analysis driven by fundamental data. Note that our analysis may not factor in the latest price-sensitive company announcements or qualitative material. Simply Wall St has no position in any stocks mentioned.
Have feedback on this article? Concerned about the content? Get in touch with us directly. Alternatively, email editorial-team@simplywallst.com