
- PREMIUM
- LIVE QUOTES
- INSTITUTIONS
 Index Options
 State Street
 CME Group
 Nasdaq
 Cboe
Cboe TradingView
 Wall Street Journal
Assessing Figma (FIG) Valuation After Recent Share Price Weakness And Premium P/S Multiple
Figma (FIG) is drawing attention after a period of weak share performance, with the stock roughly 47% lower over the past 3 months and showing only modest moves over the past week and month.
See our latest analysis for Figma.
Figma’s recent slump, with a 90 day share price return of about a 47% decline and a year to date share price return that is roughly flat, points to fading momentum as investors reassess growth potential and risk around its $37.49 share price.
If Figma’s move has you reassessing your watchlist, this could be a good moment to see what else is out there through high growth tech and AI stocks.
So, with the share price under pressure, solid top line growth, and a share price of $37.49 sitting well below the average analyst target of $61.88, is this a potential opportunity, or is the market already pricing in future growth?
Most Popular Narrative Narrative: 42.9% Undervalued
According to the narrative by TickerTickle, the implied fair value of US$65.70 sits well above Figma’s last close at US$37.49, setting up a wide valuation gap for readers to assess.
• High-margin growth: Revenue growing ~46–48 % YoY with 88–92 % gross margins.
Curious how a high growth, high margin profile translates into such a premium fair value? The narrative leans on rich profitability assumptions and a punchy future earnings multiple. Want to see exactly how those projections compare over time and across products? Read on to see what drives that US$65.70 figure.
Result: Fair Value of $65.70 (UNDERVALUED)
Have a read of the narrative in full and understand what's behind the forecasts.
However, the thesis could be shaken if growth slows against well funded competitors, or if rich profit margin and P/E assumptions prove too optimistic.
Find out about the key risks to this Figma narrative.
Another View: Market Signals A Very Different Story
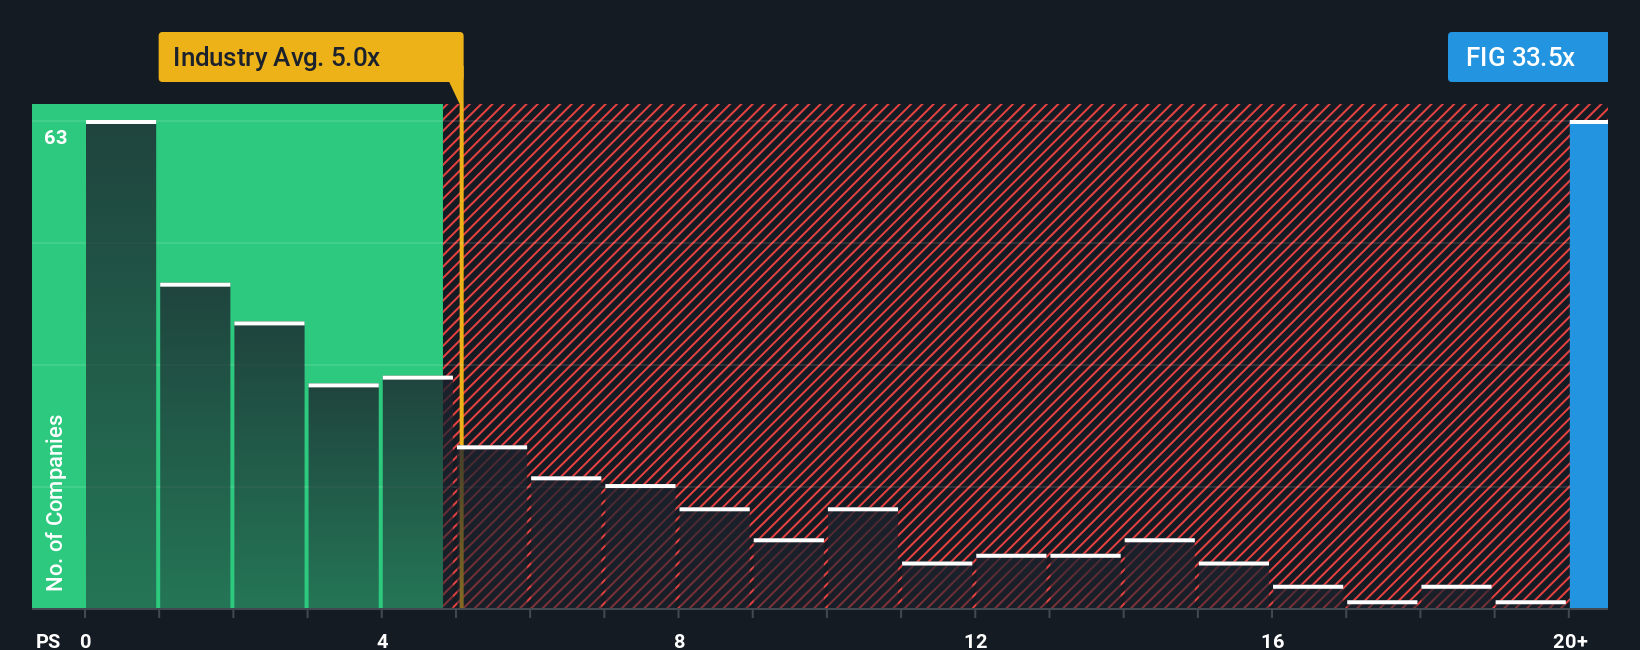
Figma’s most popular user narrative sees the shares as undervalued, but the market’s current P/S ratio tells a different story. At 19.2x sales, compared with 4.8x for the wider US Software group and 10x for peers, the stock trades at a steep premium that raises valuation risk rather than pointing to a clear bargain.
If the market eventually settles closer to those peer and industry levels, today’s price could prove demanding unless the business performance lines up strongly with that premium. The real question is which view you trust more when you decide what belongs on your watchlist.
See what the numbers say about this price — find out in our valuation breakdown.
Build Your Own Figma Narrative
If you see the data differently or just prefer to run your own numbers, you can build a fresh Figma thesis in minutes with Do it your way.
A great starting point for your Figma research is our analysis highlighting 2 key rewards and 2 important warning signs that could impact your investment decision.
Looking for more investment ideas?
If you are serious about sharpening your watchlist, do not stop at one company. Let the Simply Wall St screener surface new angles you might be missing.
- Spot potential value opportunities by checking out these 877 undervalued stocks based on cash flows that align with your preferred risk and return profile.
- Zero in on future focused themes by reviewing these 26 AI penny stocks that fit your view on long term technology adoption.
- Target portfolio income by scanning these 11 dividend stocks with yields > 3% and see which names match your yield expectations and comfort with risk.
This article by Simply Wall St is general in nature. We provide commentary based on historical data and analyst forecasts only using an unbiased methodology and our articles are not intended to be financial advice. It does not constitute a recommendation to buy or sell any stock, and does not take account of your objectives, or your financial situation. We aim to bring you long-term focused analysis driven by fundamental data. Note that our analysis may not factor in the latest price-sensitive company announcements or qualitative material. Simply Wall St has no position in any stocks mentioned.
Have feedback on this article? Concerned about the content? Get in touch with us directly. Alternatively, email editorial-team@simplywallst.com