
- PREMIUM
- LIVE QUOTES
- INSTITUTIONS
 Index Options
 State Street
 CME Group
 Nasdaq
 Cboe
Cboe TradingView
 Wall Street Journal
Is Ellington Financial (EFC) Offering Value After Recent Share Price Softness?
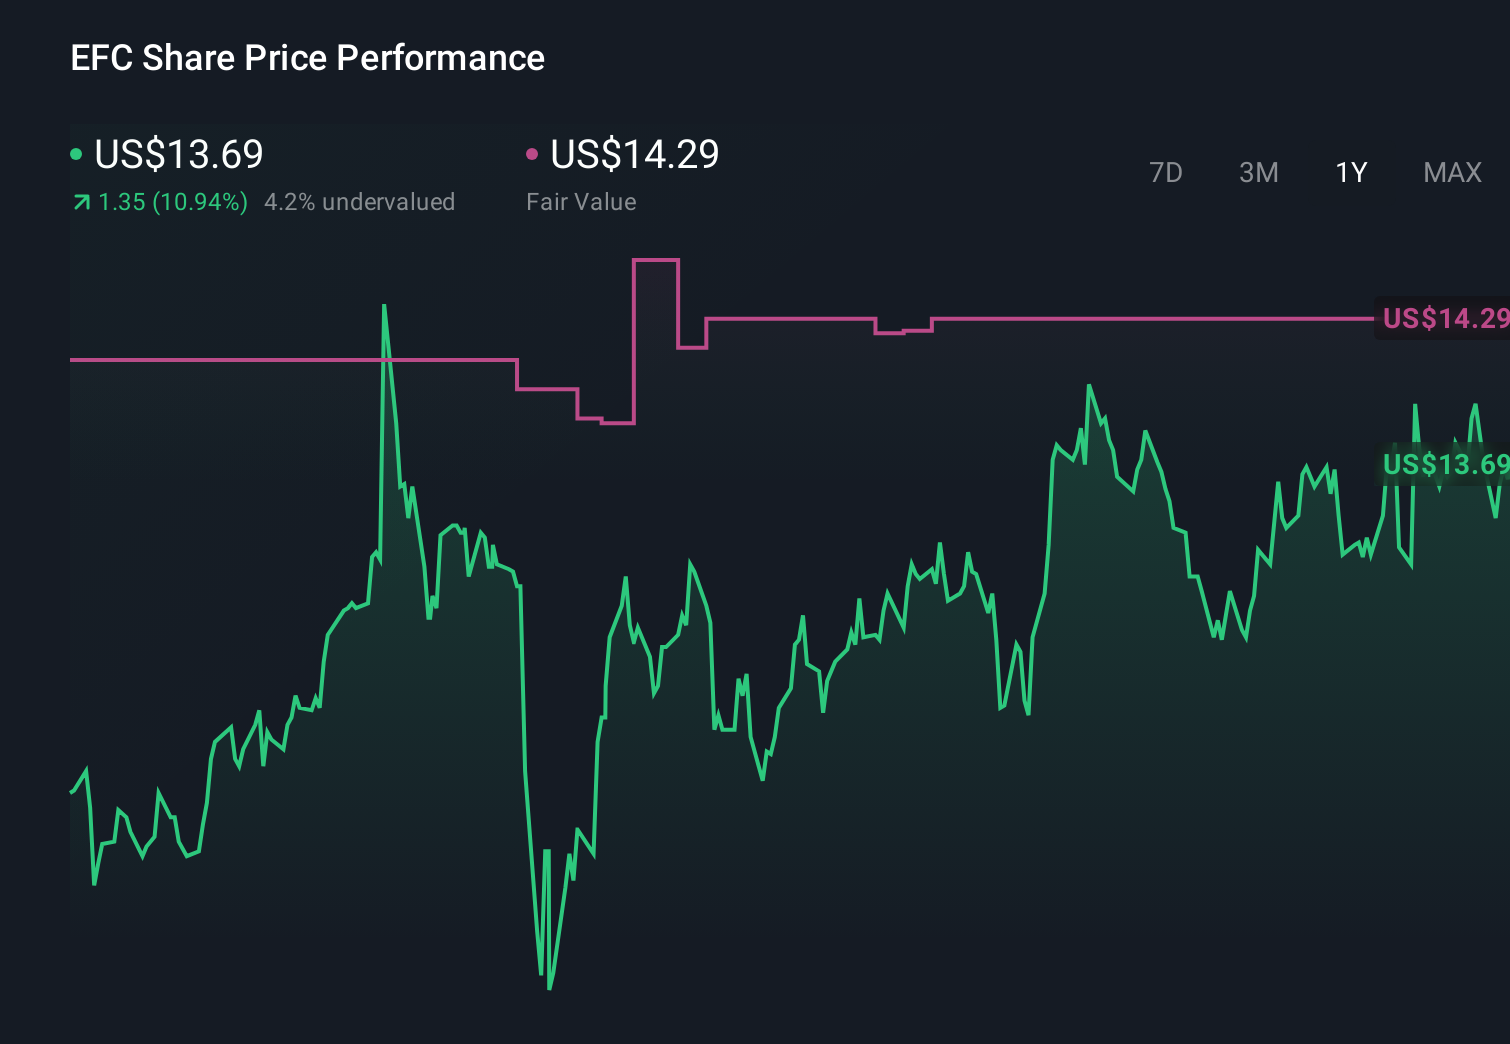
- If you are wondering whether Ellington Financial at around US$13.53 is offering good value today, you are not alone. This article is designed to walk you through that question step by step.
- The stock has had a mixed short term run, with returns of a 1.6% decline over 7 days, a 1.4% decline over 30 days and a 1.1% decline year to date. The longer term picture shows 24.4% over 1 year, 51.1% over 3 years and 62.1% over 5 years.
- Recent attention on Ellington Financial has centered around its position within the diversified financials space and how its portfolio construction and funding profile compare with peers. This context helps frame why some investors are reassessing both the potential rewards and the risks that come with the stock at its current price.
- Ellington Financial currently scores 5 out of 6 on our valuation checks, which you can see in detail in our valuation score. Next we will walk through the standard valuation methods that sit behind this before finishing with a more comprehensive way to think about what the shares might be worth.
Approach 1: Ellington Financial Excess Returns Analysis
The Excess Returns model looks at how much profit Ellington Financial can generate over and above the return that equity investors are assumed to require, and then links that to the value of its equity base per share.
For Ellington Financial, the starting point is a Book Value of $13.52 per share and a Stable EPS estimate of $1.77 per share, based on weighted future Return on Equity estimates from 4 analysts. The Average Return on Equity is 12.40%, while the model assumes a Cost of Equity of $1.30 per share. That gap translates into an Excess Return of $0.46 per share, which is what this approach treats as value created beyond investor expectations.
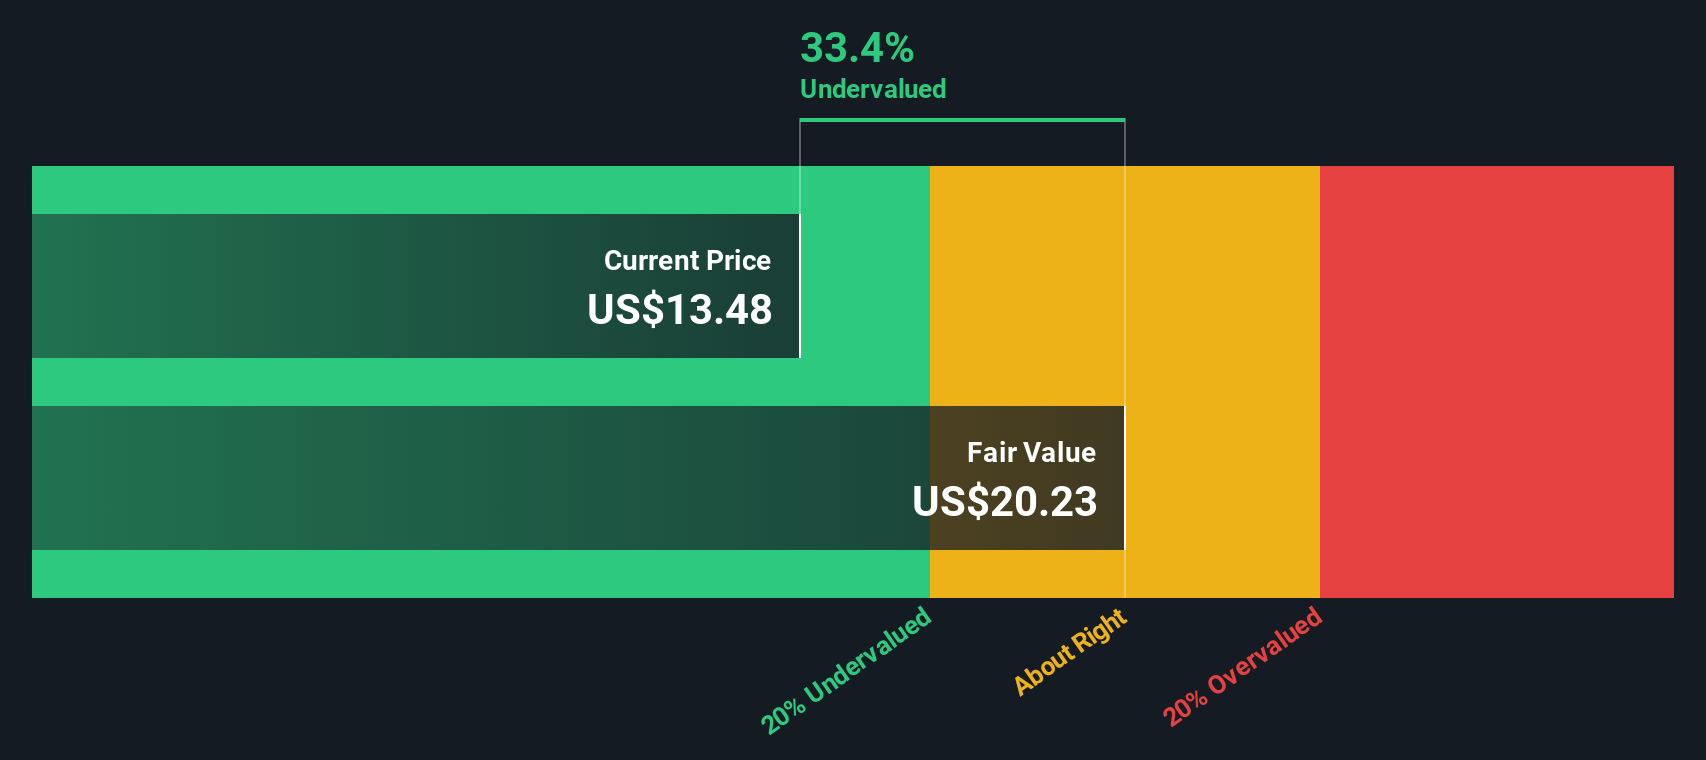
The model also uses a Stable Book Value estimate of $14.23 per share, sourced from weighted future Book Value estimates from 4 analysts, to project how these excess returns could compound over time. Putting this together, the Excess Returns valuation produces an intrinsic value of about $22.03 per share. This implies the shares are about 38.6% undervalued relative to a current price near $13.53.
Result: UNDERVALUED
Our Excess Returns analysis suggests Ellington Financial is undervalued by 38.6%. Track this in your watchlist or portfolio, or discover 876 more undervalued stocks based on cash flows.
Approach 2: Ellington Financial Price vs Earnings
For a profitable company like Ellington Financial, the P/E ratio is a useful yardstick because it ties what you pay directly to the earnings the business is producing today. In general, higher growth expectations and lower perceived risk can justify a higher “normal” P/E, while lower growth and higher risk tend to support a lower one.
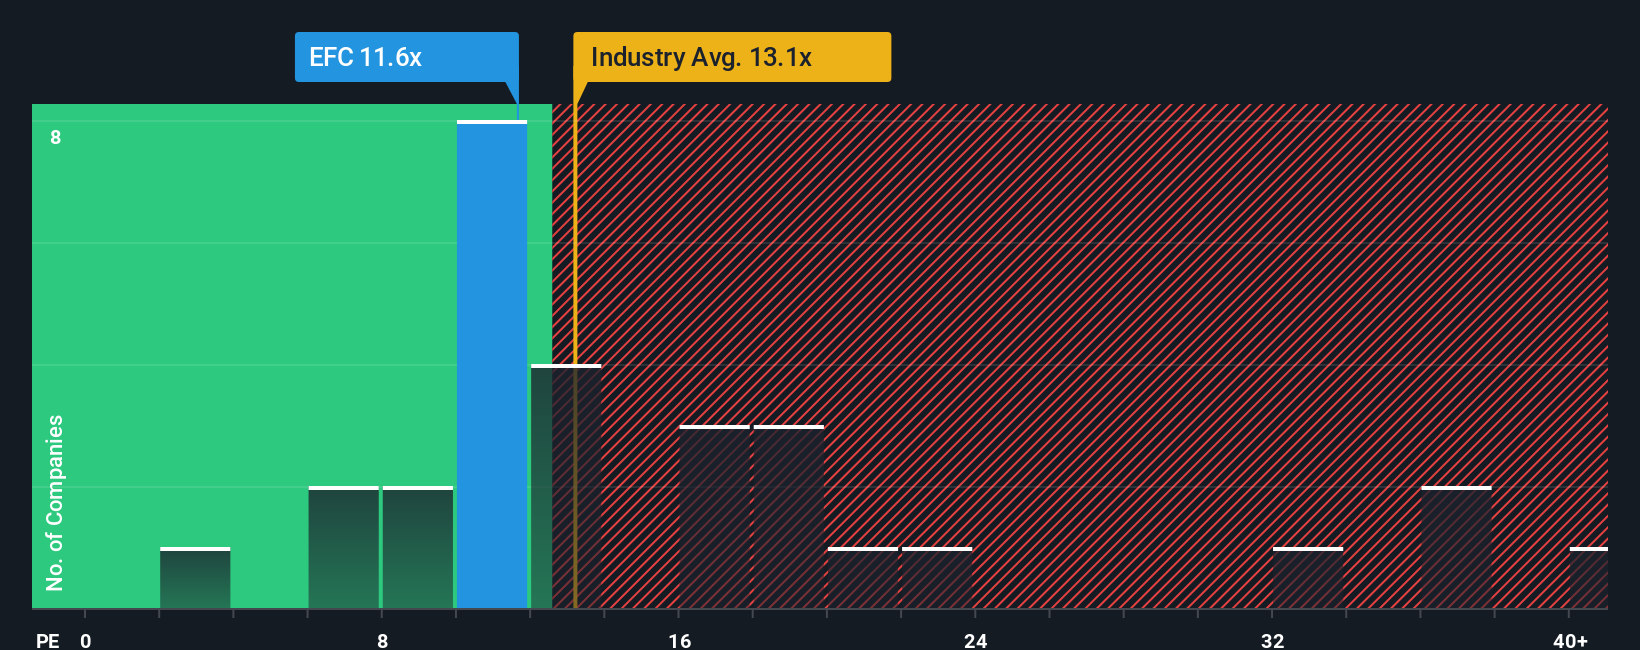
Ellington Financial currently trades on a P/E of about 11.90x. That sits slightly below the Mortgage REITs industry average of roughly 12.28x and well below the broader peer group average of around 18.49x. On the surface, that suggests the market is assigning a lower multiple compared with many similar companies.
Simply Wall St’s Fair Ratio for Ellington Financial is 13.89x. This is a proprietary estimate of what the P/E could be given factors such as the company’s earnings profile, industry, profit margins, market cap and key risks. Because it blends these elements together, the Fair Ratio can be more informative than a simple comparison with industry or peer averages that may not share the same risk and growth mix. Against this Fair Ratio, Ellington Financial’s current P/E of 11.90x points to the shares trading below that implied level.
Result: UNDERVALUED
P/E ratios tell one story, but what if the real opportunity lies elsewhere? Discover 1449 companies where insiders are betting big on explosive growth.
Upgrade Your Decision Making: Choose your Ellington Financial Narrative
Earlier we mentioned that there is an even better way to understand valuation, so let us introduce you to Narratives, a simple tool on Simply Wall St’s Community page. With Narratives, you set your own story for Ellington Financial, link that story to forecasts for revenue, earnings and margins, and see what fair value that story implies. You can then compare this to the current price to decide whether you think the stock is expensive or cheap. The Narrative automatically updates as fresh news or earnings arrive. One investor might lean toward the higher analyst price target of US$16.00 because they focus on factors like non bank lending growth and technology. Another might sit closer to the lower US$13.50 view because they are more concerned about credit risks and funding. Both perspectives can be saved, shared and refined over time.
Do you think there's more to the story for Ellington Financial? Head over to our Community to see what others are saying!
This article by Simply Wall St is general in nature. We provide commentary based on historical data and analyst forecasts only using an unbiased methodology and our articles are not intended to be financial advice. It does not constitute a recommendation to buy or sell any stock, and does not take account of your objectives, or your financial situation. We aim to bring you long-term focused analysis driven by fundamental data. Note that our analysis may not factor in the latest price-sensitive company announcements or qualitative material. Simply Wall St has no position in any stocks mentioned.
Have feedback on this article? Concerned about the content? Get in touch with us directly. Alternatively, email editorial-team@simplywallst.com