
- PREMIUM
- LIVE QUOTES
- INSTITUTIONS
 Index Options
 State Street
 CME Group
 Nasdaq
 Cboe
Cboe TradingView
 Wall Street Journal
Is Pool Corporation (POOL) Pricing Reflect Its Mixed Valuation Signals After Recent Share Weakness
- If you are wondering whether Pool's share price still reflects its underlying business, you are not alone. This article focuses on what the numbers say about value rather than short term excitement.
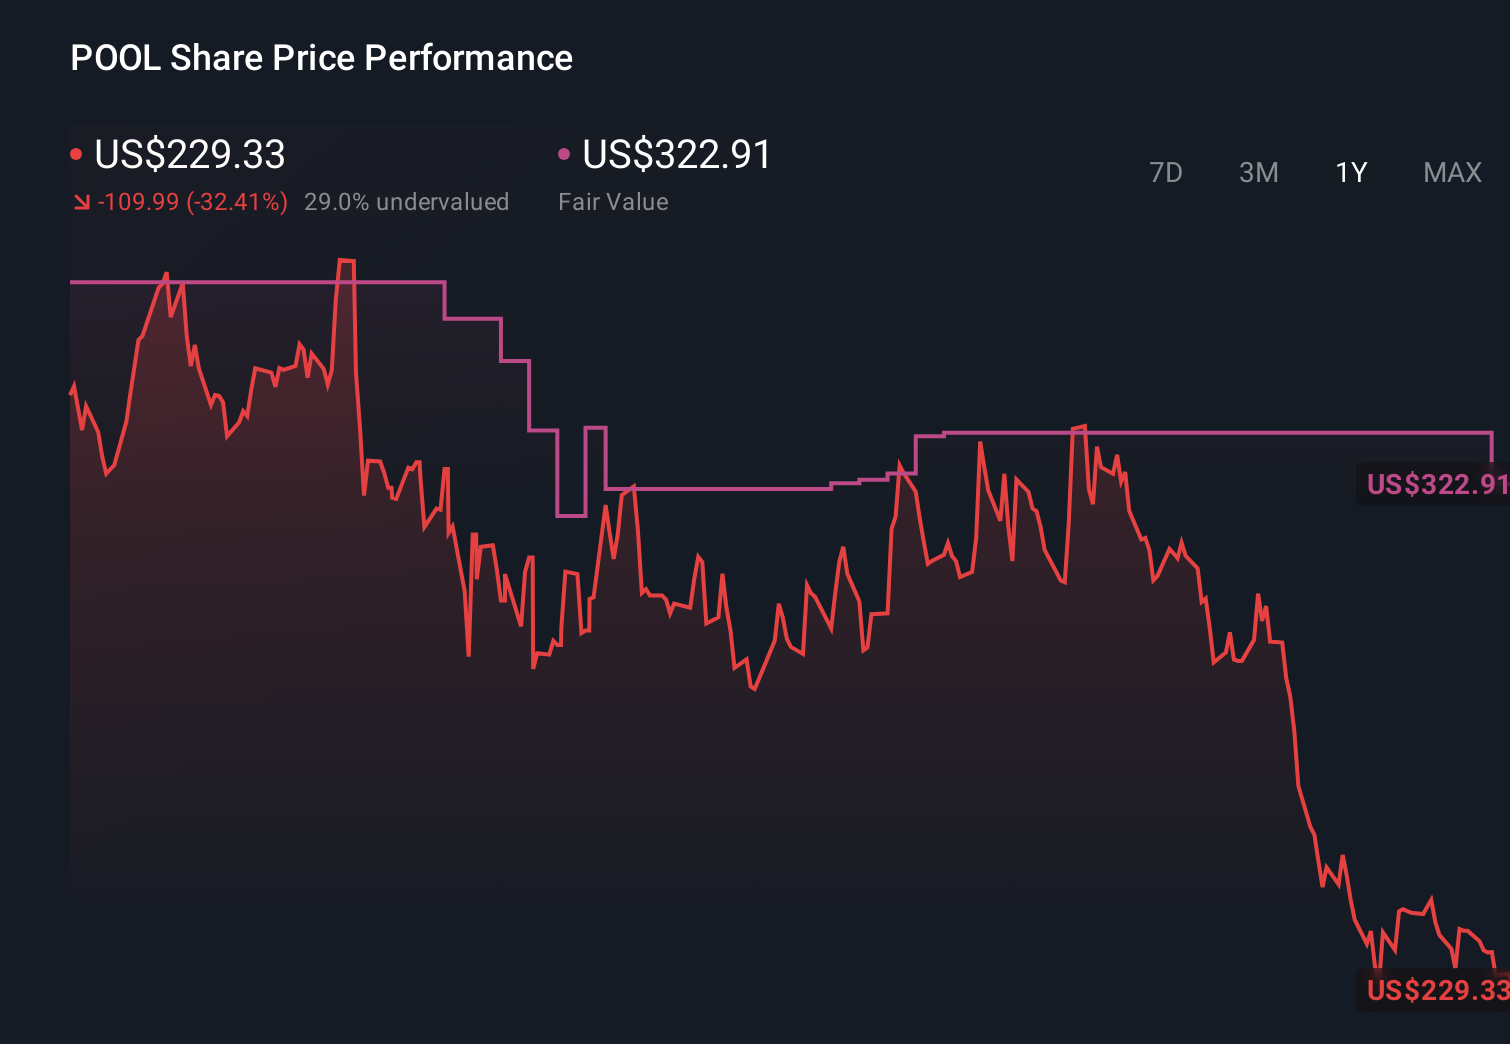
- Pool closed at US$239.38, with returns of 3.6% over the last 7 days, roughly flat at a 0.1% decline over 30 days, a 4.2% gain year to date, and longer term share price declines of 25.8% over 1 year, 23.3% over 3 years, and 34.1% over 5 years.
- These moves are set against a backdrop of ongoing interest in U.S. consumer and housing related names, as investors weigh how pool and outdoor spending fits into household budgets over time. Broader sector commentary around discretionary spending and housing related activity continues to shape how the market views companies like Pool.
- Right now Pool scores a 4/6 valuation check score, which suggests there is more to unpack about how it is priced using different methods. Later in the article we will also look at an even more rounded way of thinking about value beyond a single score.
Find out why Pool's -25.8% return over the last year is lagging behind its peers.
Approach 1: Pool Discounted Cash Flow (DCF) Analysis
A Discounted Cash Flow model takes the cash that a company is expected to generate in the future and works backwards, discounting those cash flows to estimate what they are worth in today’s dollars.
For Pool, the model used is a 2 Stage Free Cash Flow to Equity approach. The latest twelve month free cash flow is about $396.6 million. Analysts provide explicit projections out to 2028, where free cash flow is estimated at $482 million. The model then extrapolates further cash flows out to 2035 using gradually changing growth assumptions supplied by Simply Wall St.
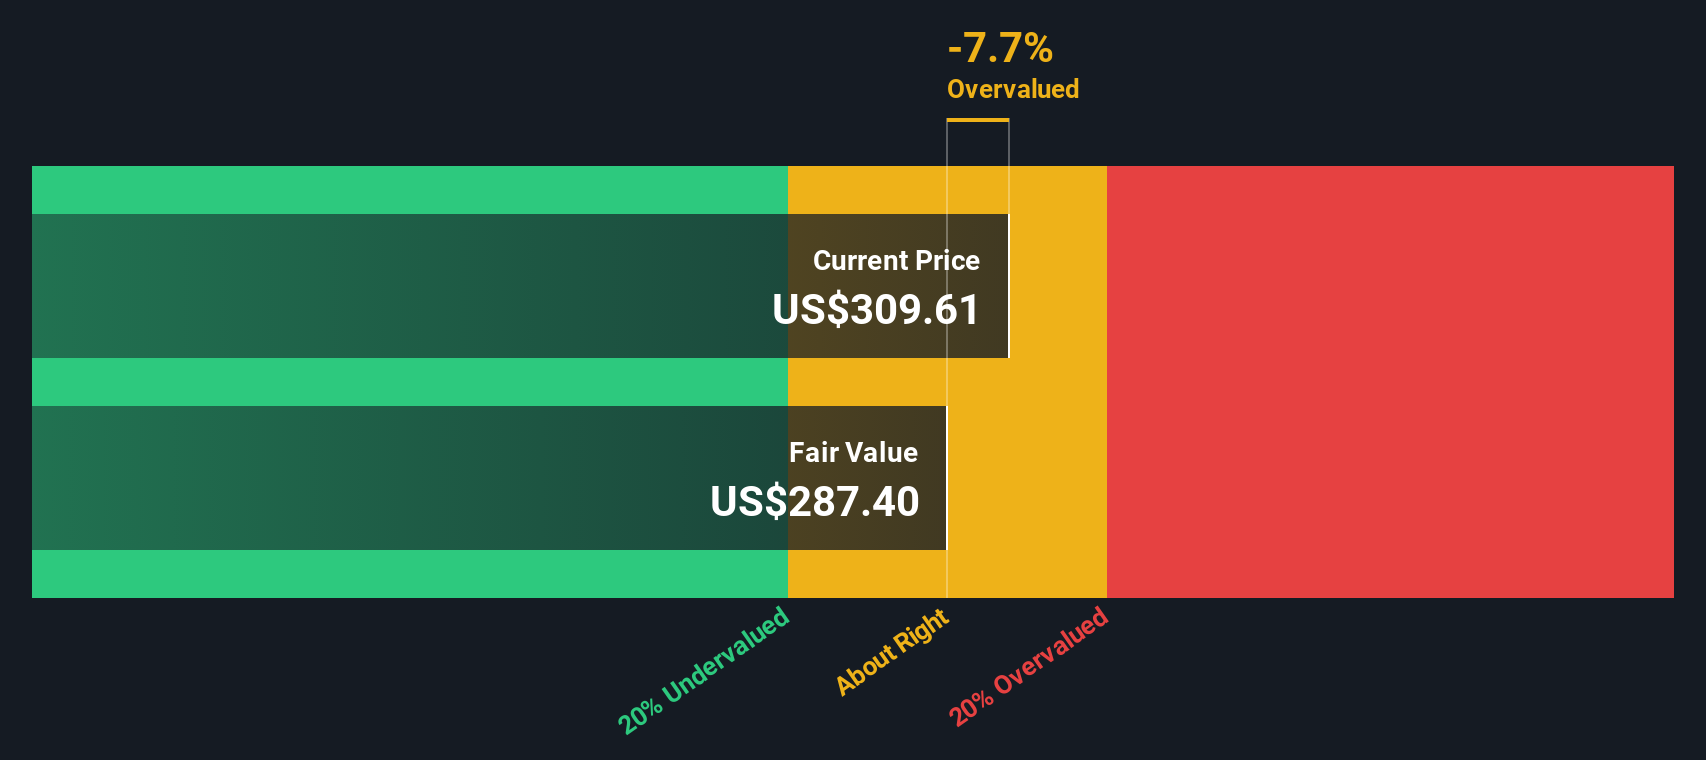
When all these projected cash flows are discounted back to today, the DCF model arrives at an estimated intrinsic value of about $303.03 per share. Compared with the recent share price of $239.38, this implies the shares trade at roughly a 21.0% discount to that intrinsic value. On this model the stock appears undervalued.
Result: UNDERVALUED
Our Discounted Cash Flow (DCF) analysis suggests Pool is undervalued by 21.0%. Track this in your watchlist or portfolio, or discover 875 more undervalued stocks based on cash flows.
Approach 2: Pool Price vs Earnings
For profitable companies like Pool, the P/E ratio is a useful way to think about what you are paying for each dollar of current earnings. It ties the share price directly to earnings, which are a core driver of long term returns.
What counts as a “normal” P/E depends on how the market views a company’s growth prospects and risk. Higher expected growth or lower perceived risk can justify a higher P/E, while slower expected growth or higher risk can point to a lower “fair” P/E.
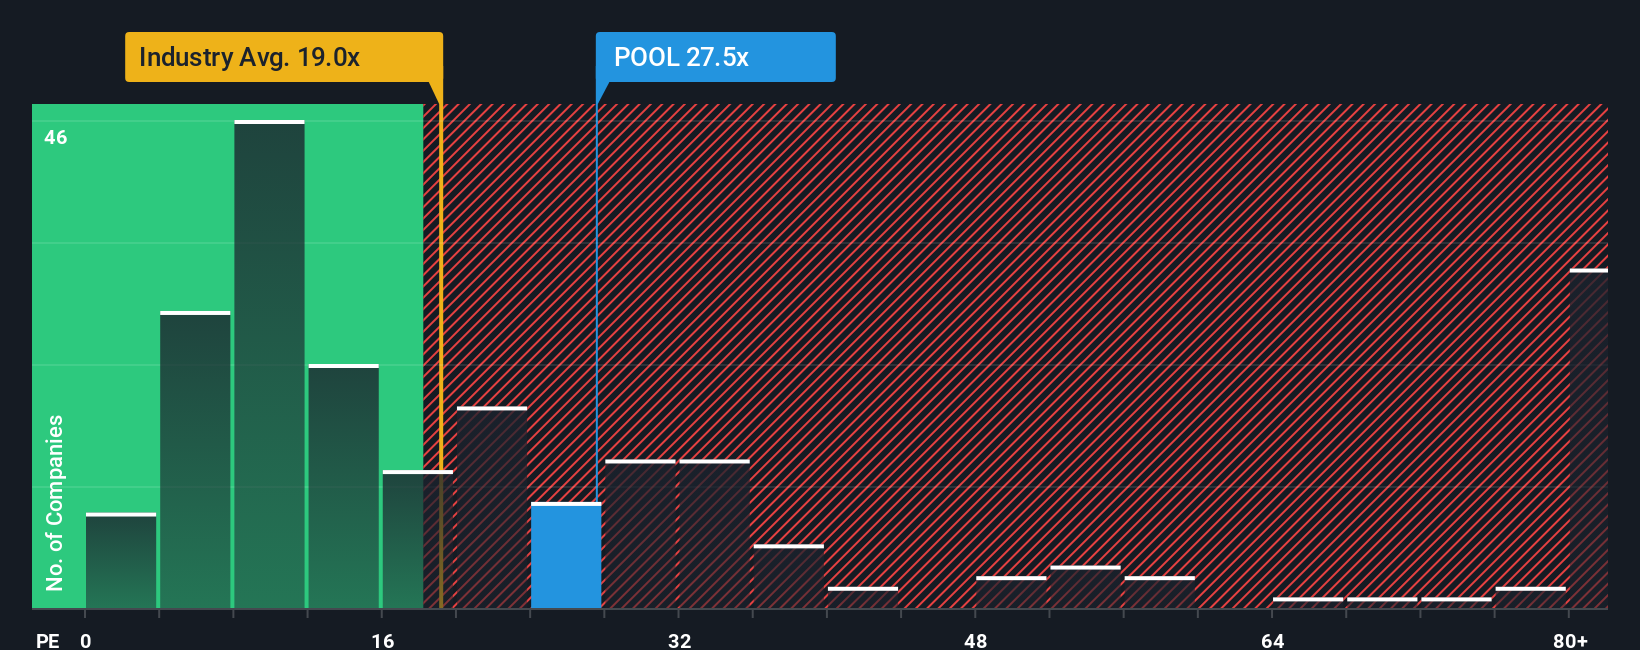
Pool currently trades on a P/E of 21.7x. That is above the Retail Distributors industry average of 17.7x, while the broader peer group used here has an average P/E of 42.9x. Simply Wall St’s Fair Ratio, which estimates what Pool’s P/E might be given factors like its earnings profile, industry, profit margin, market cap and risk characteristics, is 14.9x.
Because the Fair Ratio incorporates company specific drivers instead of only comparing Pool with peers or the industry, it can provide a more tailored yardstick. With the current 21.7x P/E higher than the 14.9x Fair Ratio, this approach suggests the shares are pricing in more than the model implies.
Result: OVERVALUED
P/E ratios tell one story, but what if the real opportunity lies elsewhere? Discover 1449 companies where insiders are betting big on explosive growth.
Upgrade Your Decision Making: Choose your Pool Narrative
Earlier we mentioned that there is an even better way to understand valuation. Narratives on Simply Wall St let you turn your view of Pool into a clear story that links what you think about its future revenues, earnings and margins to a financial forecast, a fair value and a simple comparison with the current price, all inside the Community page where millions of investors share their work.
A Narrative is your version of Pool’s story written in numbers. You set assumptions such as future revenue growth, profit margins, discount rate and P/E, and the tool converts that into an estimated fair value that you can compare directly with today’s share price to help frame whether you see upside or downside.
Because Narratives update automatically when new information such as earnings, company announcements or analyst forecasts are added to the platform, your fair value view stays linked to the latest data without you needing to rebuild your model each time.
For example, one Pool Narrative on Simply Wall St might use the current analyst fair value of about US$322.91 per share as a starting point. Another could lean closer to the higher US$375 price target or the lower US$285 view. Seeing these side by side can help you decide which story best fits your own expectations for the business.
Do you think there's more to the story for Pool? Head over to our Community to see what others are saying!
This article by Simply Wall St is general in nature. We provide commentary based on historical data and analyst forecasts only using an unbiased methodology and our articles are not intended to be financial advice. It does not constitute a recommendation to buy or sell any stock, and does not take account of your objectives, or your financial situation. We aim to bring you long-term focused analysis driven by fundamental data. Note that our analysis may not factor in the latest price-sensitive company announcements or qualitative material. Simply Wall St has no position in any stocks mentioned.
Have feedback on this article? Concerned about the content? Get in touch with us directly. Alternatively, email editorial-team@simplywallst.com