
Has Baidu (BIDU) Run Too Far After Its 77% One Year Share Price Rally
- If you have been wondering whether Baidu’s recent run makes it expensive or still interesting, this article will walk through what the current share price actually bakes in.
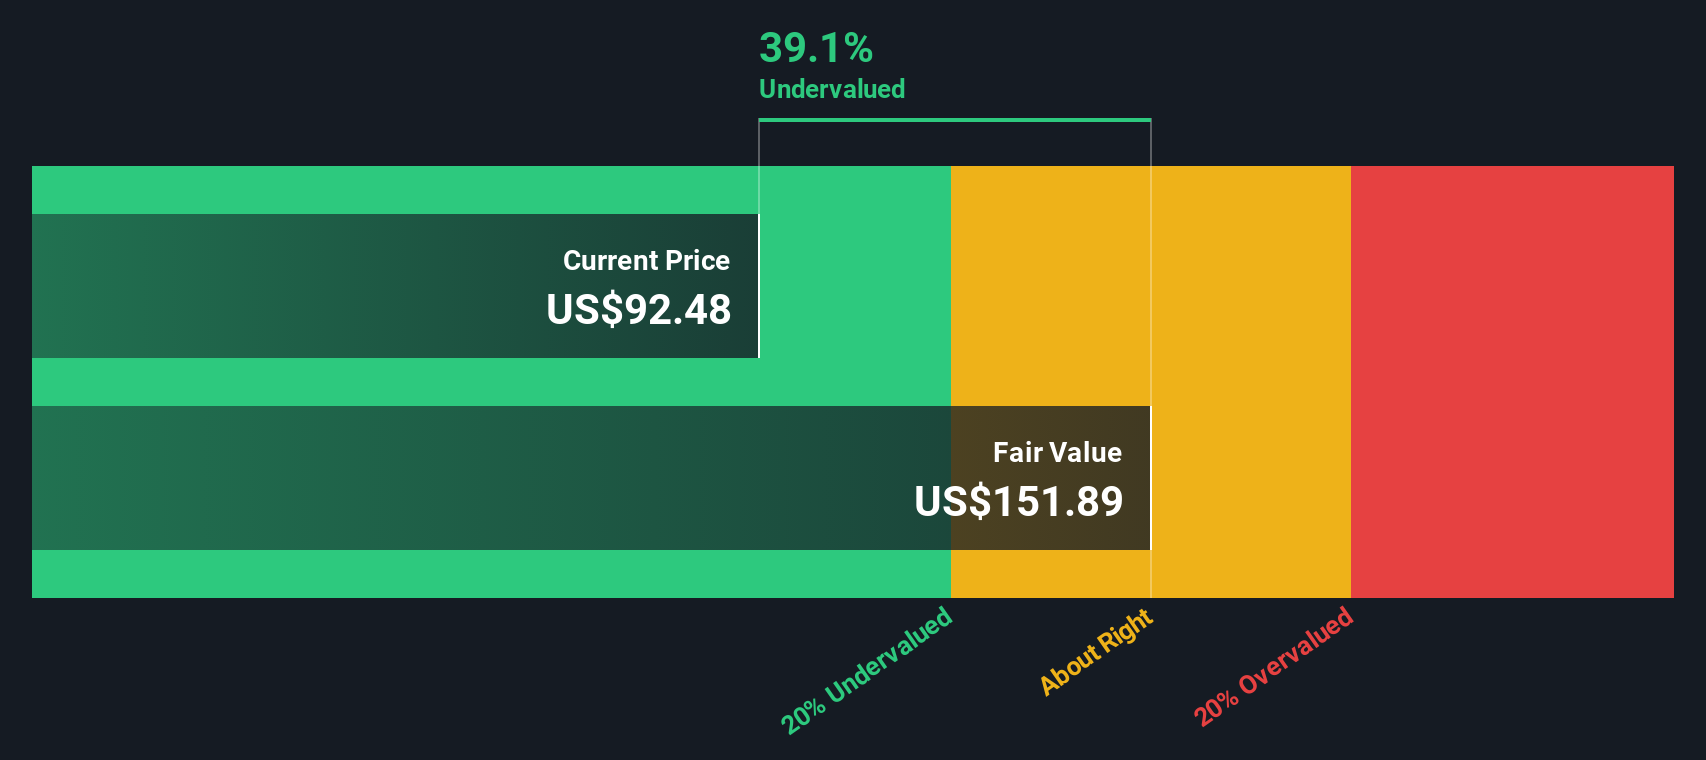
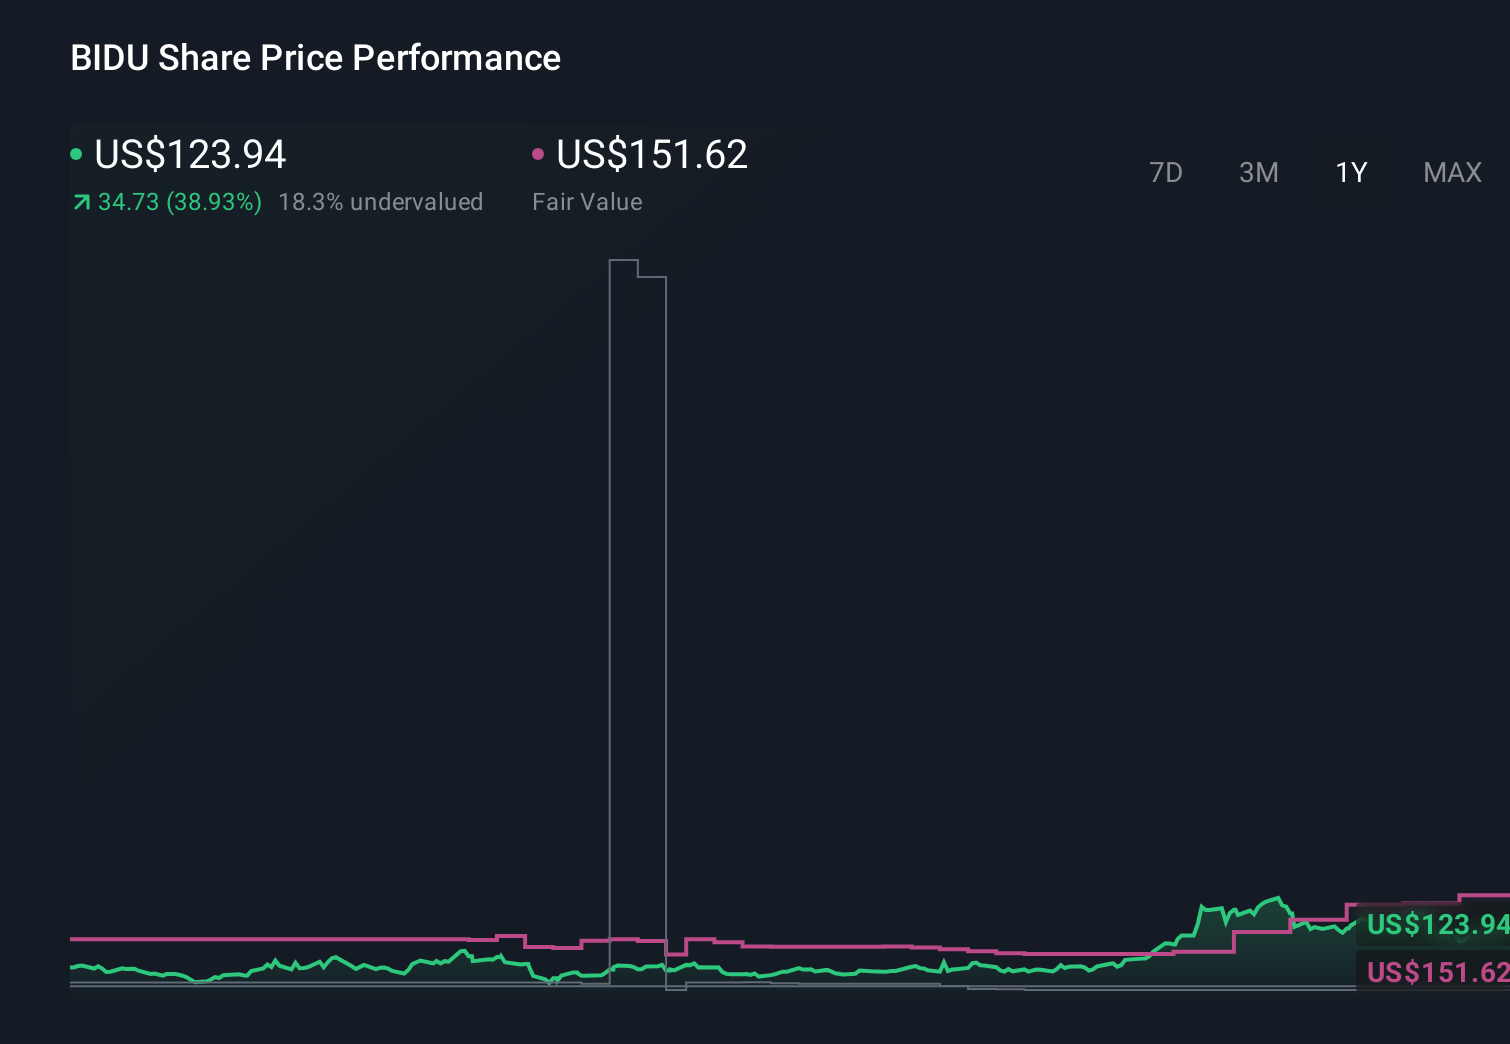
- The stock closed at US$146.42, with returns of 10.6% over the last 7 days, 16.5% over the last 30 days, and 77.2% over the last year. Year to date it is at a 2.6% decline, and the 5-year return sits at a 38.9% decline.
- These price moves sit against an ongoing stream of headlines around Chinese technology companies and their regulatory environment, as well as investor interest in large internet platforms with exposure to artificial intelligence and cloud services. Together, that backdrop helps explain why sentiment around Baidu can shift quickly even when the underlying business focus appears consistent.
- Our valuation model currently gives Baidu a score of 1 out of 6. Next, we will run through what different valuation methods say about the stock today and then finish with a framework that can help you judge these numbers in a more complete way.
Baidu scores just 1/6 on our valuation checks. See what other red flags we found in the full valuation breakdown.
Approach 1: Baidu Discounted Cash Flow (DCF) Analysis
A DCF model projects a company’s future cash flows and then discounts them back to today’s value, aiming to estimate what the whole business could be worth right now.
For Baidu, the model used is a 2 Stage Free Cash Flow to Equity approach, working in CN¥. The latest twelve month free cash flow is a loss of CN¥13.68b. Analysts have provided forecasts for several years ahead, and Simply Wall St extrapolates beyond that, with projected free cash flow in 2035 of CN¥18.27b, discounted back to today in the model.
Putting those projected cash flows together, the DCF output points to an estimated intrinsic value of US$102.59 per share. Compared with the recent share price of US$146.42, that implies Baidu trades at roughly a 42.7% premium to this DCF estimate. On this model alone the shares screen as expensive.
Result: OVERVALUED
Our Discounted Cash Flow (DCF) analysis suggests Baidu may be overvalued by 42.7%. Discover 875 undervalued stocks or create your own screener to find better value opportunities.
Approach 2: Baidu Price vs Earnings
For profitable companies, the P/E ratio is a useful yardstick because it tells you how many dollars investors are currently willing to pay for each dollar of earnings. That matters because higher growth expectations and lower perceived risk usually justify a higher P/E, while slower growth and higher risk generally line up with a lower, more cautious multiple.
Baidu currently trades on a P/E of 41.79x. That sits well above the Interactive Media and Services industry average P/E of 15.44x, and below the peer group average of 65.78x. Simply Wall St also calculates a Fair Ratio of 36.39x for Baidu, which is the P/E that would typically line up with the company’s own mix of earnings growth, industry, profit margin, market cap and risk profile.
This Fair Ratio is more tailored than a simple comparison to peers or the industry because it aims to adjust for Baidu’s specific characteristics rather than assuming all companies should trade at the same multiple. Comparing Baidu’s current P/E of 41.79x to the Fair Ratio of 36.39x suggests the shares trade at a premium to that tailored benchmark, so they screen as overvalued on this measure.
Result: OVERVALUED

P/E ratios tell one story, but what if the real opportunity lies elsewhere? Discover 1449 companies where insiders are betting big on explosive growth.
Upgrade Your Decision Making: Choose your Baidu Narrative
Earlier we mentioned that there is an even better way to understand valuation. Let us introduce you to Narratives, which are simple stories that you and other investors build around Baidu’s numbers. You can link a view on its AI, cloud, and robotaxi future to explicit forecasts for revenue, earnings, margins, and a fair value that you can compare with today’s share price.
Do you think there's more to the story for Baidu? Head over to our Community to see what others are saying!
This article by Simply Wall St is general in nature. We provide commentary based on historical data and analyst forecasts only using an unbiased methodology and our articles are not intended to be financial advice. It does not constitute a recommendation to buy or sell any stock, and does not take account of your objectives, or your financial situation. We aim to bring you long-term focused analysis driven by fundamental data. Note that our analysis may not factor in the latest price-sensitive company announcements or qualitative material. Simply Wall St has no position in any stocks mentioned.
Have feedback on this article? Concerned about the content? Get in touch with us directly. Alternatively, email editorial-team@simplywallst.com