
- PREMIUM
- LIVE QUOTES
- INSTITUTIONS
 Index Options
 State Street
 CME Group
 Nasdaq
 Cboe
Cboe TradingView
 Wall Street Journal
Is Blue Owl Capital (OWL) Pricing Look Stretched After Mixed Long Term Returns
- If you are wondering whether Blue Owl Capital's current share price offers good value, you are not alone. This article will focus squarely on what the numbers say about that question.
- The stock last closed at US$16.04, with returns of 7.0% over the past week, a 1.2% decline over the last 30 days, 4.8% year to date, a 25.9% decline over 1 year, 57.5% over 3 years and 74.4% over 5 years.
- Those mixed returns have kept Blue Owl on many investors' watchlists, especially as alternative asset managers remain in focus for their role in capital markets. Recent coverage has largely centered on how investors are reassessing this part of the sector and what that might mean for future flows into listed asset management businesses.
- On our valuation checklist Blue Owl Capital scores 2 out of 6, as shown in the valuation score. Next we will look at what traditional methods like DCFs and multiples suggest about the stock, before finishing with a more complete way to think about its value.
Blue Owl Capital scores just 2/6 on our valuation checks. See what other red flags we found in the full valuation breakdown.
Approach 1: Blue Owl Capital Excess Returns Analysis
The Excess Returns model looks at how much profit a company is expected to generate above the return that shareholders require. If the return on equity is below that required return, the excess return is negative and the model typically points to a low intrinsic value.
For Blue Owl Capital, the inputs are:
- Book Value: US$3.45 per share
- Stable EPS: US$0.14 per share (source: median Return on Equity from the past 5 years)
- Cost of Equity: US$0.30 per share
- Excess Return: US$0.15 per share
- Average Return on Equity: 4.07%
- Stable Book Value: US$3.50 per share (source: median Book Value from the past 5 years)
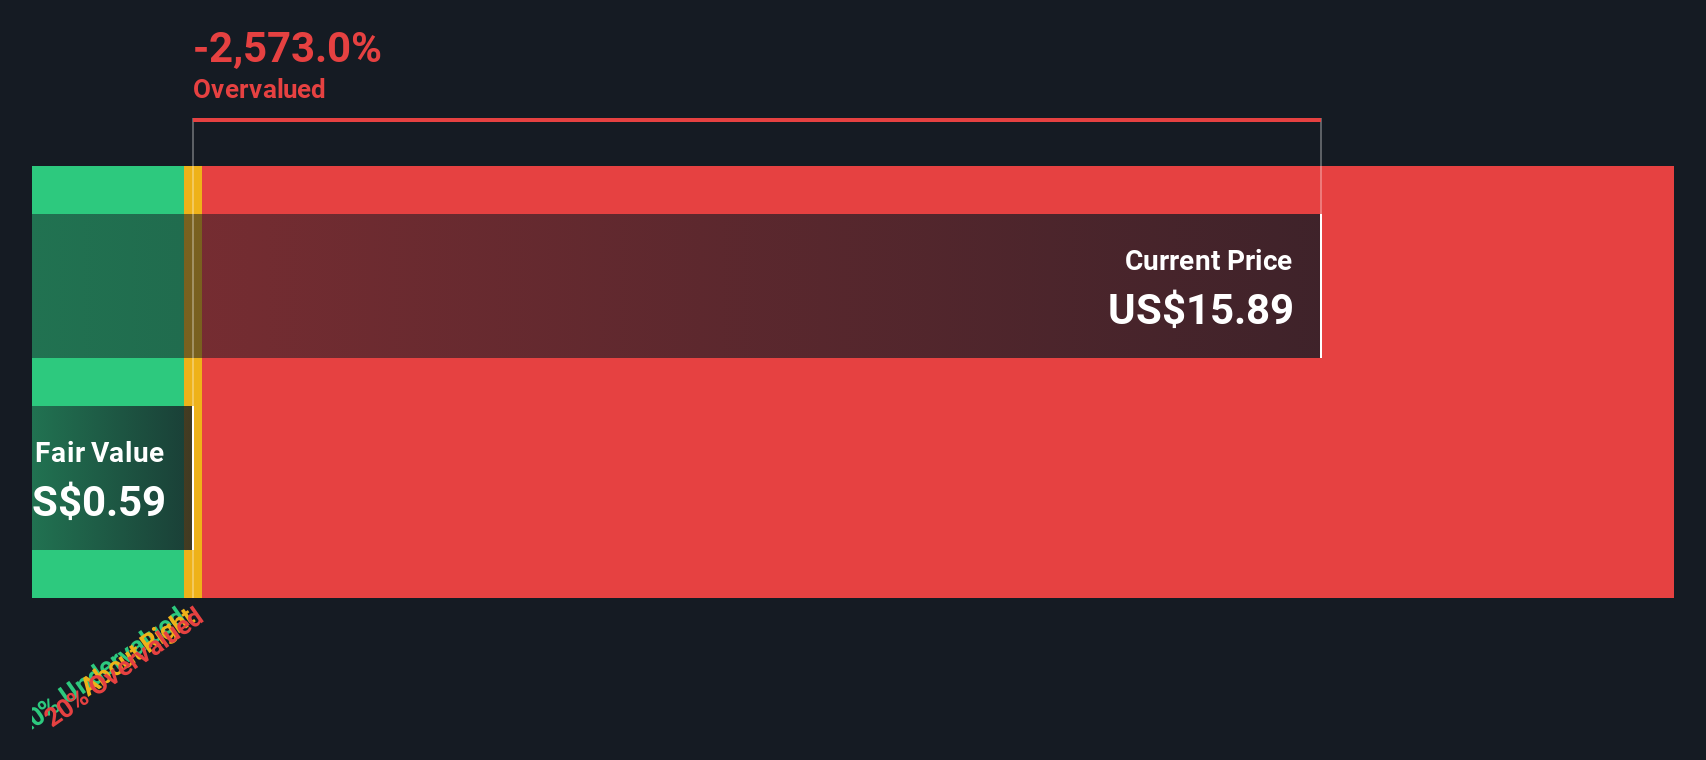
Because the model estimates a negative excess return, it produces a very low intrinsic value per share of about US$0.54. Compared with the recent share price of US$16.04, the Excess Returns model signals that the stock is very expensive and, on this view, significantly overvalued.
Result: OVERVALUED
Our Excess Returns analysis suggests Blue Owl Capital may be overvalued by 2851.0%. Discover 876 undervalued stocks or create your own screener to find better value opportunities.
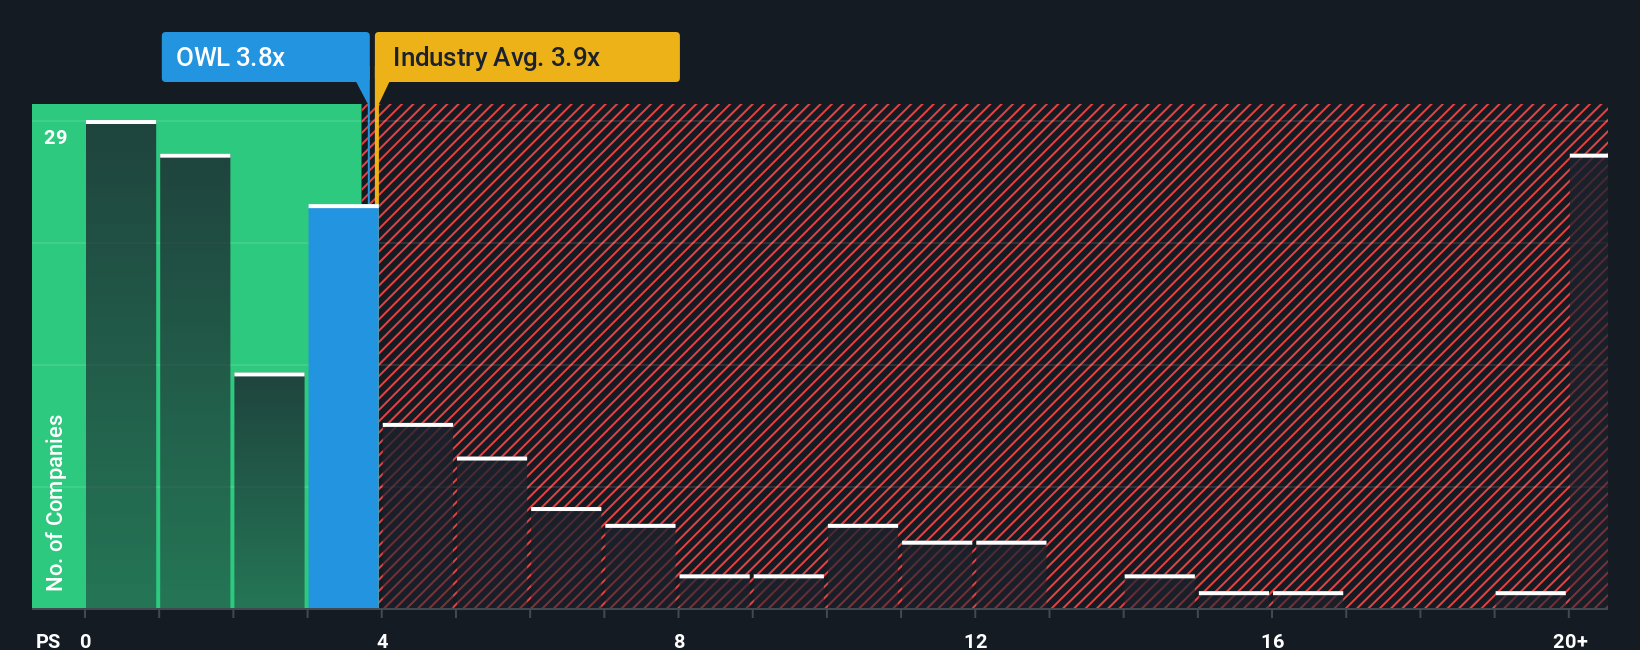
Approach 2: Blue Owl Capital Price vs Sales
For profitable asset managers, P/S is a useful sense check because it links the value of the business to the revenue it generates, which can be more stable than earnings from one year to the next.
In general, higher growth expectations and lower perceived risk can justify a higher P/S multiple, while slower growth and higher risk tend to support a lower, more conservative range. The key question is what looks “normal” for Blue Owl given its profile and sector.
Blue Owl currently trades on a P/S of 3.88x. That is slightly below the Capital Markets industry average of 4.28x and just under the peer group average of 4.15x. Simply Wall St also calculates a proprietary “Fair Ratio” of 3.76x for Blue Owl, which reflects factors such as its earnings growth profile, industry, profit margins, size and risk characteristics.
This Fair Ratio aims to be more tailored than a simple peer or industry comparison because it adjusts for the company’s own fundamentals rather than assuming it should trade in line with the group.
Comparing the Fair Ratio of 3.76x with the actual P/S of 3.88x suggests Blue Owl is slightly overvalued on this measure.
Result: OVERVALUED
P/S ratios tell one story, but what if the real opportunity lies elsewhere? Discover 1449 companies where insiders are betting big on explosive growth.
Upgrade Your Decision Making: Choose your Blue Owl Capital Narrative
Earlier we mentioned that there is an even better way to understand valuation, so on Simply Wall St you can use Narratives on the Community page to connect your own story for Blue Owl Capital to a set of revenue, earnings and margin forecasts that roll into a fair value. You can then compare that fair value with the current price to decide whether the stock looks attractive or expensive to you, see that view update as new news or earnings arrive, and even compare different perspectives. For example, one investor might focus on long term growth in private credit, real assets and AI linked data centers with a fair value around US$20.82, while another might be more cautious about acquisition risk and fundraising, which can justify a lower fair value for the same company.
Do you think there's more to the story for Blue Owl Capital? Head over to our Community to see what others are saying!

This article by Simply Wall St is general in nature. We provide commentary based on historical data and analyst forecasts only using an unbiased methodology and our articles are not intended to be financial advice. It does not constitute a recommendation to buy or sell any stock, and does not take account of your objectives, or your financial situation. We aim to bring you long-term focused analysis driven by fundamental data. Note that our analysis may not factor in the latest price-sensitive company announcements or qualitative material. Simply Wall St has no position in any stocks mentioned.
Have feedback on this article? Concerned about the content? Get in touch with us directly. Alternatively, email editorial-team@simplywallst.com