
- PREMIUM
- LIVE QUOTES
- INSTITUTIONS
 Index Options
 State Street
 CME Group
 Nasdaq
 Cboe
Cboe TradingView
 Wall Street Journal
Assessing Shanghai Henlius Biotech (SEHK:2696) Valuation After HLX37 Enters Phase 1 Clinical Study
Shanghai Henlius Biotech (SEHK:2696) has dosed the first patient in its phase 1 trial of HLX37, a bispecific antibody that targets PD-L1 and VEGF in advanced or metastatic solid tumours in Mainland China.
See our latest analysis for Shanghai Henlius Biotech.
The HLX37 trial update comes after a mixed stretch for the stock, with a 1-day share price return of 2.00% and a 7-day share price return of 11.92% but a 90-day share price return of 15.71%. However, the 1-year total shareholder return of 171.13% and 3-year total shareholder return of over 3x suggest longer term momentum has been strong even if shorter term sentiment has been more muted, and the shares now trade at HK$63.85.
If you are looking beyond a single biotech name, this could be a good moment to scan other healthcare stocks that might fit your portfolio. It is a straightforward way to spot more potential ideas in the sector.
With HLX37 moving into the clinic, annual revenue growth of 13.3% and an intrinsic value model suggesting a 64% discount, is Shanghai Henlius Biotech still flying under the radar, or is the market already pricing in future growth?
Price-to-Earnings of 37.8x: Is it justified?
Shanghai Henlius Biotech closed at HK$63.85 and is trading on a P/E of 37.8x, which screens as good value relative to some peers but looks expensive against its own estimated fair P/E.
The P/E multiple compares the current share price to earnings per share and is a common way to see how much investors are paying for each unit of profit. For a biotech group with meaningful product revenue and positive earnings, it is a quick way to check how the market is treating its profit stream.
Our data suggests the shares are good value versus both the peer group average P/E of 42.1x and the Asian biotech industry average of 38.3x. However, the estimated fair P/E for Shanghai Henlius Biotech is 19.8x, which is far lower than the current 37.8x. This gap points to a valuation level the market could potentially move toward if expectations reset.
Explore the SWS fair ratio for Shanghai Henlius Biotech
Result: Price-to-Earnings of 37.8x (ABOUT RIGHT)
However, there are still clear pressure points, including the 15.7% 90 day share price decline and the risk that early stage assets like HLX37 may not progress as planned.
Find out about the key risks to this Shanghai Henlius Biotech narrative.
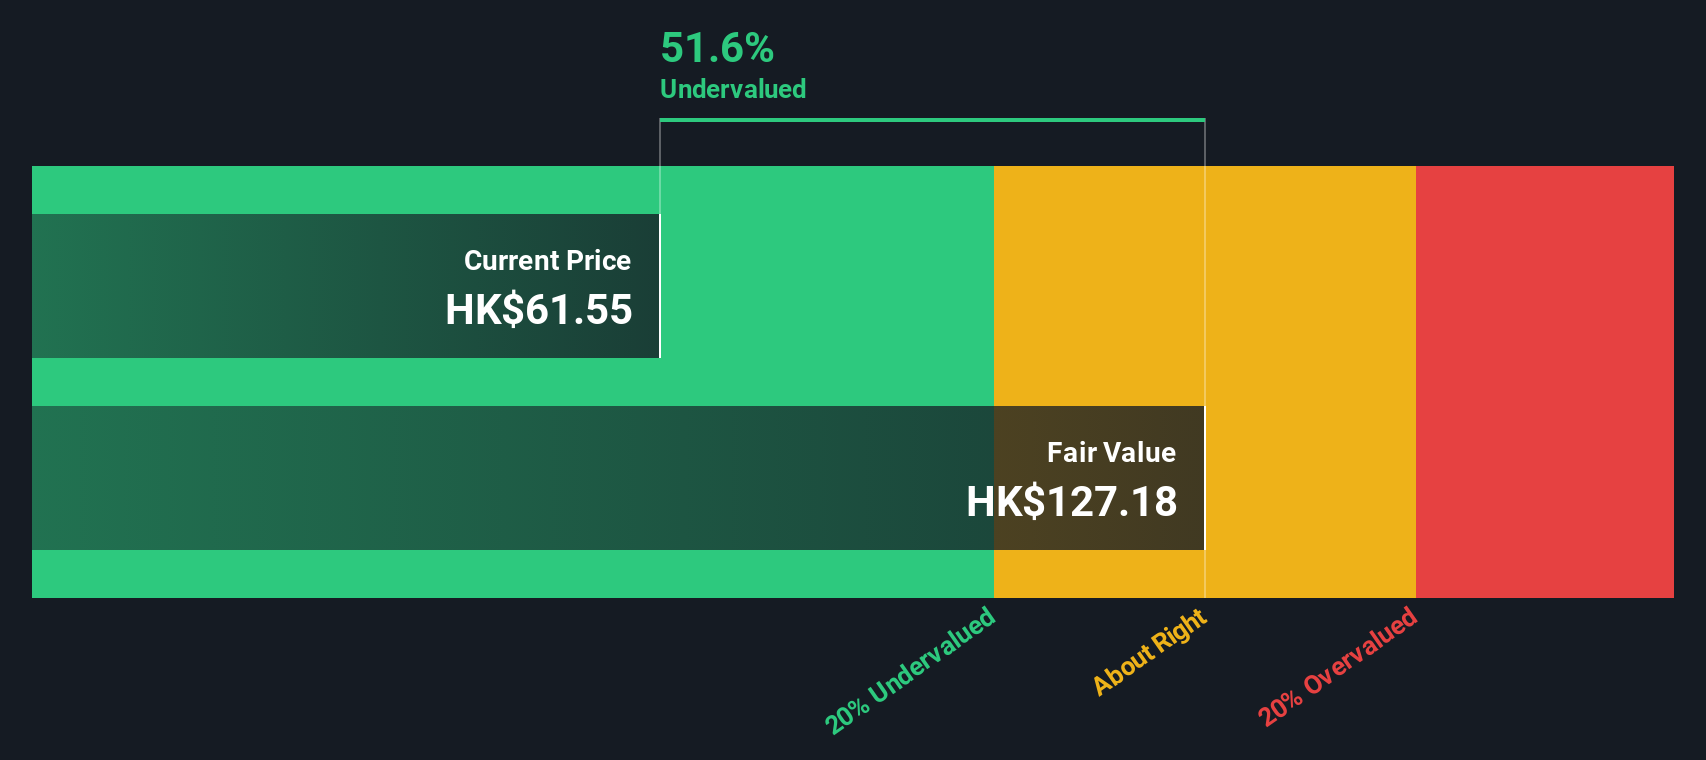
Another view: what does the DCF say?
The P/E ratio suggests Shanghai Henlius Biotech is reasonably priced against peers, but our DCF model points a different way. With the shares at HK$63.85 and our fair value estimate at HK$177.56, the stock screens as heavily undervalued. Is the market underestimating its pipeline, or is the model too optimistic?
Look into how the SWS DCF model arrives at its fair value.
Simply Wall St performs a discounted cash flow (DCF) on every stock in the world every day (check out Shanghai Henlius Biotech for example). We show the entire calculation in full. You can track the result in your watchlist or portfolio and be alerted when this changes, or use our stock screener to discover 878 undervalued stocks based on their cash flows. If you save a screener we even alert you when new companies match - so you never miss a potential opportunity.
Build Your Own Shanghai Henlius Biotech Narrative
If you look at these numbers and reach a different conclusion, or simply prefer to test the assumptions yourself, you can build a custom view of Shanghai Henlius Biotech in just a few minutes, starting with Do it your way.
A great starting point for your Shanghai Henlius Biotech research is our analysis highlighting 3 key rewards and 1 important warning sign that could impact your investment decision.
Looking for more investment ideas?
Do not stop with one company. This can be a useful time to identify a few more ideas that match what you want your portfolio to do next.
- Start building a watchlist of smaller names that interest you by checking out these 3556 penny stocks with strong financials with financials that pass an initial quality filter.
- Target stronger cash flow stories by scanning these 878 undervalued stocks based on cash flows that currently trade below what their projected cash flows suggest.
- Lean into long term themes in healthcare by reviewing these 29 healthcare AI stocks that connect medical data, diagnostics and AI driven decision support.
This article by Simply Wall St is general in nature. We provide commentary based on historical data and analyst forecasts only using an unbiased methodology and our articles are not intended to be financial advice. It does not constitute a recommendation to buy or sell any stock, and does not take account of your objectives, or your financial situation. We aim to bring you long-term focused analysis driven by fundamental data. Note that our analysis may not factor in the latest price-sensitive company announcements or qualitative material. Simply Wall St has no position in any stocks mentioned.
Have feedback on this article? Concerned about the content? Get in touch with us directly. Alternatively, email editorial-team@simplywallst.com