
- PREMIUM
- LIVE QUOTES
- INSTITUTIONS
 Index Options
 State Street
 CME Group
 Nasdaq
 Cboe
Cboe TradingView
 Wall Street Journal
Is It Time To Reconsider Vericel (VCEL) After Recent Share Price Volatility?
- If you are wondering whether Vericel's current share price lines up with its underlying worth, this article walks through the numbers in a clear, structured way.
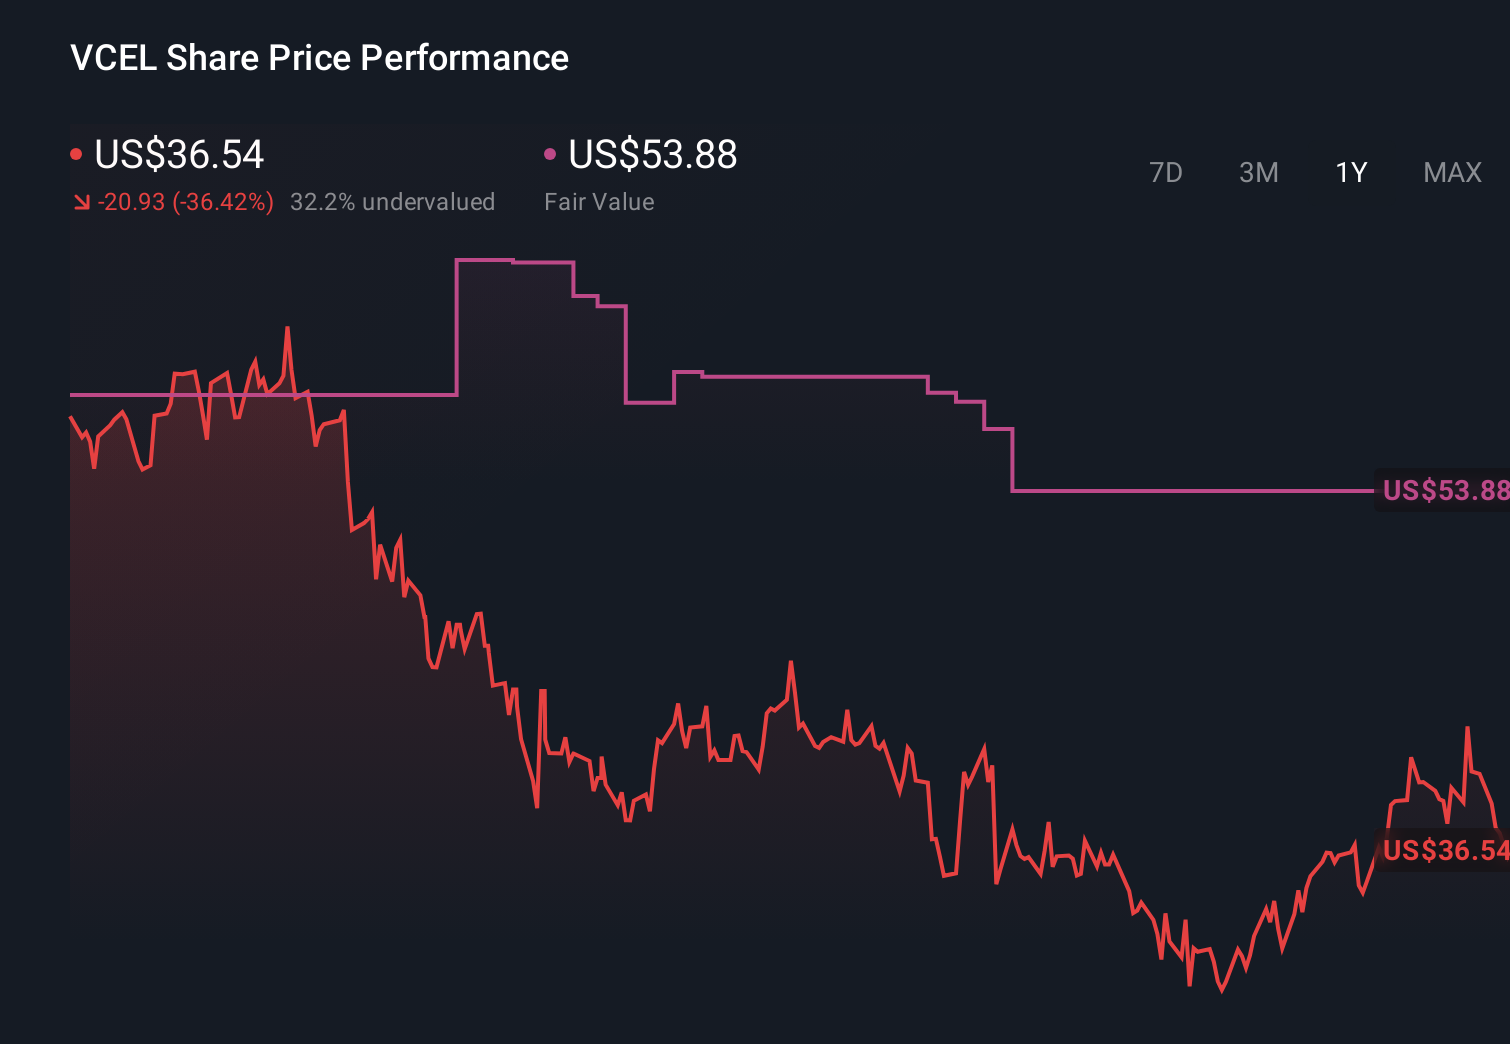
- Vericel recently closed at US$39.34, with returns of 9.2% over 7 days, 5.5% over 30 days, 10.5% year to date, a 33.9% decline over 1 year, 42.4% over 3 years and 6.6% over 5 years. Taken together, these figures provide a mix of shorter term momentum and longer term context.
- That performance sits against a backdrop of ongoing interest in cell based therapies and regenerative medicine, where investor attention often shifts as product adoption, clinical progress or regulatory milestones develop. These broader sector themes help frame why sentiment around Vericel can change quickly, even without a single headline driving the move.
- On our framework, Vericel scores a 3 out of 6 valuation checks, which suggests some areas point to undervaluation while others look more fully priced. Next, we walk through different valuation approaches before closing with a way to tie them together into a more complete picture.
Find out why Vericel's -33.9% return over the last year is lagging behind its peers.
Approach 1: Vericel Discounted Cash Flow (DCF) Analysis
A Discounted Cash Flow, or DCF, model takes estimates of the cash a business might generate in the future, then discounts those cash flows back into today’s dollars to arrive at an estimate of intrinsic value per share.
For Vericel, the model used is a 2 Stage Free Cash Flow to Equity approach. The latest twelve month free cash flow is about $16.68 million. Simply Wall St then projects free cash flow out to 2035, combining analyst estimates for the nearer years with extrapolated figures beyond the usual 5 year window. For example, the model uses projected free cash flows of $23.51 million in 2026 and $67.18 million in 2035, with each year discounted back to reflect the time value of money.
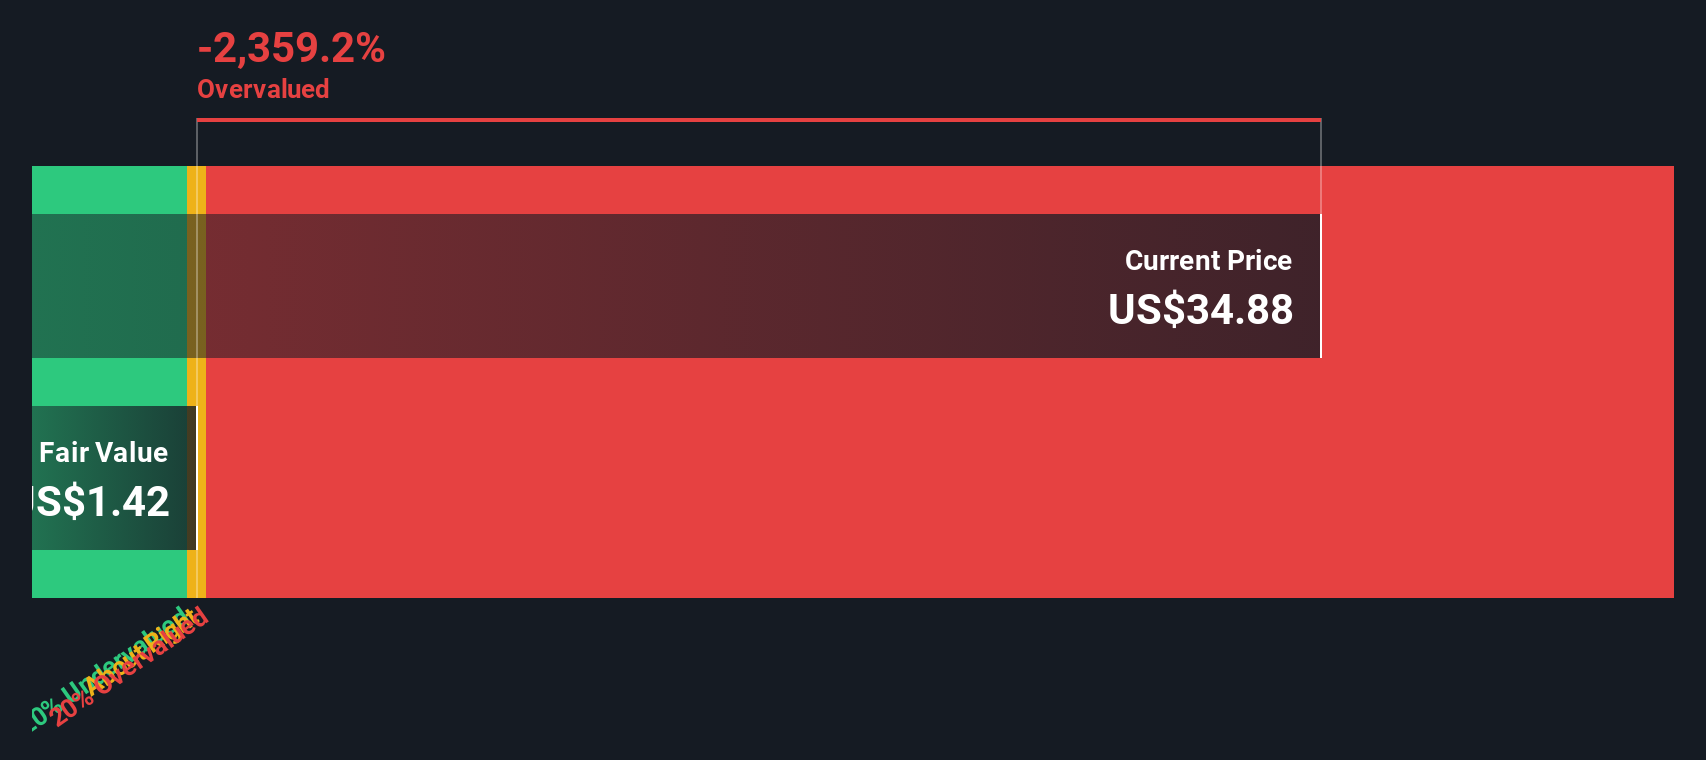
Pulling all of those discounted cash flows together results in an estimated intrinsic value of about $24.21 per share, compared with the recent share price of $39.34. That gap implies Vericel trades at roughly a 62.5% premium to this DCF estimate. On this model the shares appear expensive rather than cheap.
Result: OVERVALUED
Our Discounted Cash Flow (DCF) analysis suggests Vericel may be overvalued by 62.5%. Discover 877 undervalued stocks or create your own screener to find better value opportunities.
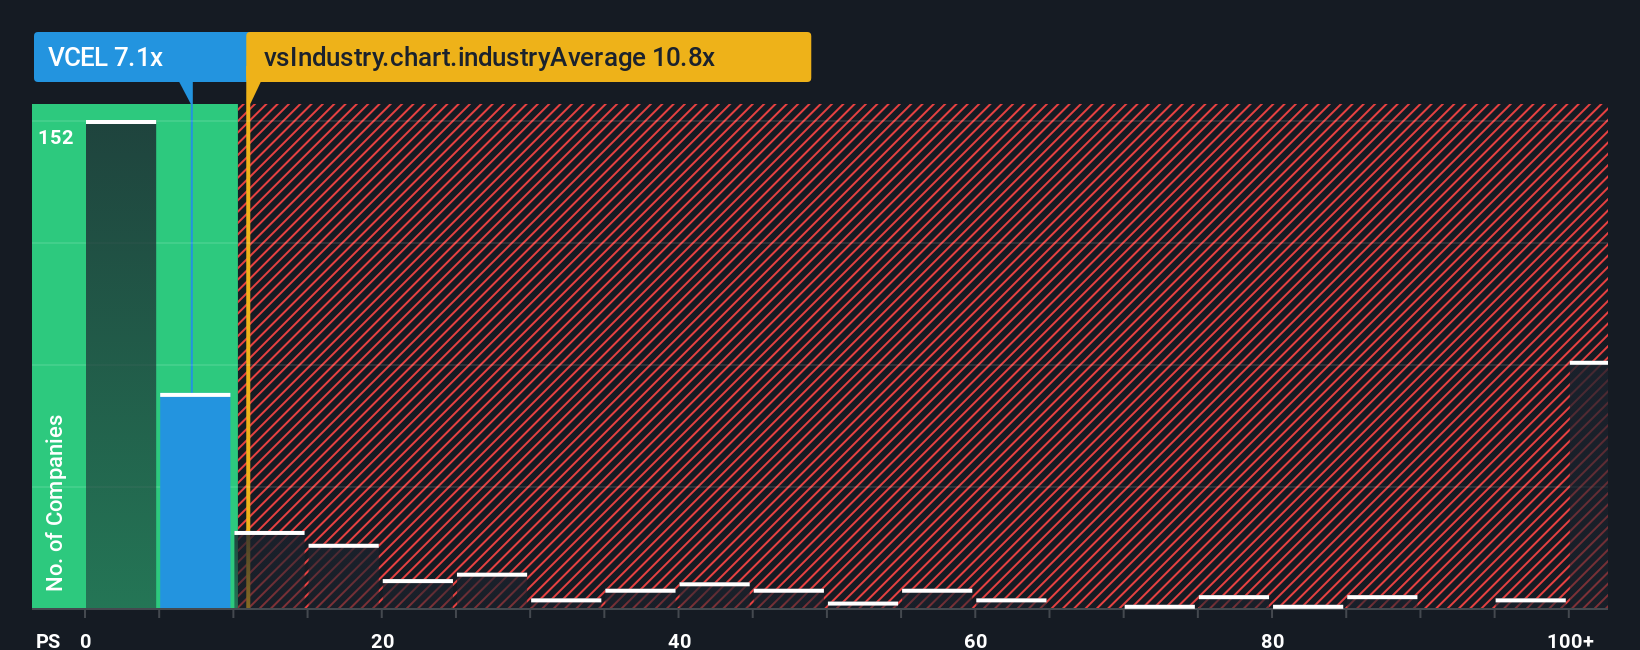
Approach 2: Vericel Price vs Sales
For companies where profits may not fully reflect the business yet, the P/S ratio is often a useful yardstick because it compares what you pay to the revenue the company already generates.
In general, higher growth expectations or lower perceived risk can justify a higher P/S ratio, while slower growth or higher risk tends to point to a lower, more conservative multiple as a fair level.
Vericel currently trades on a P/S of 7.69x. That sits below the Biotechs industry average P/S of 11.66x, and also below the peer group average of 21.19x. This suggests the market is paying less for each dollar of Vericel's sales than for many comparable names.
Simply Wall St also calculates a proprietary “Fair Ratio” for Vericel of 5.72x. This figure reflects factors such as earnings growth, profit margins, industry, market cap and specific risks, rather than relying only on broad peer or sector comparisons.
Because the Fair Ratio incorporates these company level features, it can offer a more tailored anchor than just looking at where the wider Biotechs group trades.
Comparing the Fair Ratio of 5.72x with the current P/S of 7.69x suggests Vericel shares price in a premium to this model based view of fair value.
Result: OVERVALUED
P/S ratios tell one story, but what if the real opportunity lies elsewhere? Discover 1447 companies where insiders are betting big on explosive growth.
Upgrade Your Decision Making: Choose your Vericel Narrative
Earlier we mentioned that there is an even better way to understand valuation. On Simply Wall St's Community page you can use Narratives, which let you set out your own story for Vericel by linking its surgeon expansion, product concentration and margin outlook to specific forecasts for future revenue, earnings and profit margins. This turns those forecasts into a fair value that you can compare with the current share price to guide your buy or sell decisions. Because Narratives update automatically when new earnings, guidance or news comes through, you can see, for example, how one investor might build a more optimistic view using the higher analyst earnings and price target assumptions, while another leans on the lower earnings and price target figures, with both views visible side by side on the platform used by millions of investors.
Do you think there's more to the story for Vericel? Head over to our Community to see what others are saying!
This article by Simply Wall St is general in nature. We provide commentary based on historical data and analyst forecasts only using an unbiased methodology and our articles are not intended to be financial advice. It does not constitute a recommendation to buy or sell any stock, and does not take account of your objectives, or your financial situation. We aim to bring you long-term focused analysis driven by fundamental data. Note that our analysis may not factor in the latest price-sensitive company announcements or qualitative material. Simply Wall St has no position in any stocks mentioned.
Have feedback on this article? Concerned about the content? Get in touch with us directly. Alternatively, email editorial-team@simplywallst.com