
- PREMIUM
- LIVE QUOTES
- INSTITUTIONS
 Index Options
 State Street
 CME Group
 Nasdaq
 Cboe
Cboe TradingView
 Wall Street Journal
Why Interactive Brokers Group (IBKR) Is Up 12.1% After Clients Outperform S&P 500 In 2025
- In late 2025, Interactive Brokers Group reported December metrics showing 3.384 million Daily Average Revenue Trades, client equity of US$779.9 billion, and client margin loan balances of US$90.2 billion, alongside a 32% year-over-year increase in accounts to 4.399 million.
- The company also disclosed that its individual and hedge fund clients, supported by low trading costs and global market access, collectively outperformed the S&P 500 Index in 2025, highlighting the platform’s role in enhancing realised investment outcomes for users.
- We’ll now examine how this combination of strong client equity growth and reported index outperformance may influence Interactive Brokers’ investment narrative.
AI is about to change healthcare. These 29 stocks are working on everything from early diagnostics to drug discovery. The best part - they are all under $10b in market cap - there's still time to get in early.
Interactive Brokers Group Investment Narrative Recap
To own Interactive Brokers Group, you need to believe in its ability to keep attracting active, globally minded investors who value low costs and broad market access. The December update, with higher client equity, margin balances and accounts alongside client outperformance, supports that thesis, but does not materially change the near term dependence on healthy trading activity or the key risk from potential shifts in interest rates and market volatility.
The announcement that individual and hedge fund clients outperformed the S&P 500 Index in 2025, helped by reported all in trading costs of 2.6 basis points for IBKR PRO U.S. stock trades, is especially relevant here. It ties directly into the core catalyst of growing client accounts and assets, as cost sensitive investors may be attracted to a platform that emphasises execution quality and global access while still being exposed to volume and rate driven revenue swings.
Yet, behind this strong client performance and asset growth, investors should also be aware that...
Read the full narrative on Interactive Brokers Group (it's free!)
Interactive Brokers Group's narrative projects $5.9 billion revenue and $740.3 million earnings by 2028. This requires 5.9% yearly revenue growth and about a $42.3 million earnings increase from $698.0 million today.
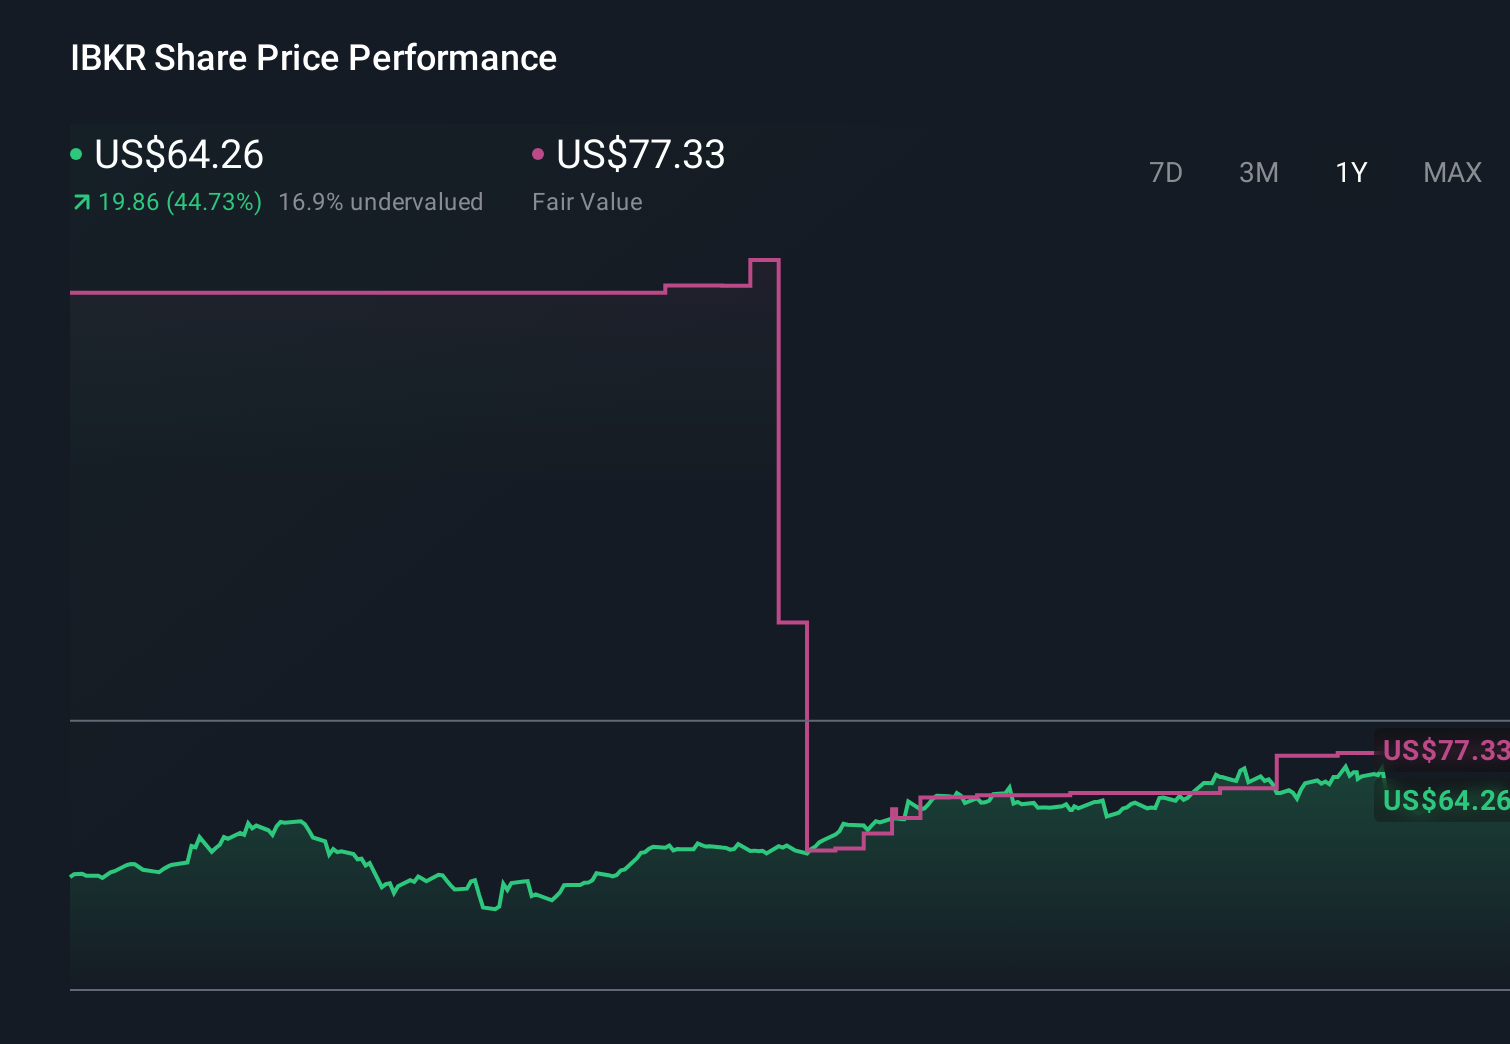
Uncover how Interactive Brokers Group's forecasts yield a $77.33 fair value, a 6% upside to its current price.
Exploring Other Perspectives
Twelve Simply Wall St Community fair value estimates for Interactive Brokers span roughly US$26.65 to US$77.33, reflecting very different views on upside. Set those alongside the company’s reliance on trading volumes and interest income, and it becomes clear you should compare several viewpoints before forming a view on how those drivers might shape future results.
Explore 12 other fair value estimates on Interactive Brokers Group - why the stock might be worth less than half the current price!
Build Your Own Interactive Brokers Group Narrative
Disagree with existing narratives? Create your own in under 3 minutes - extraordinary investment returns rarely come from following the herd.
- A great starting point for your Interactive Brokers Group research is our analysis highlighting 2 key rewards and 1 important warning sign that could impact your investment decision.
- Our free Interactive Brokers Group research report provides a comprehensive fundamental analysis summarized in a single visual - the Snowflake - making it easy to evaluate Interactive Brokers Group's overall financial health at a glance.
Interested In Other Possibilities?
Right now could be the best entry point. These picks are fresh from our daily scans. Don't delay:
- We've found 11 US stocks that are forecast to pay a dividend yield of over 6% next year. See the full list for free.
- Find companies with promising cash flow potential yet trading below their fair value.
- This technology could replace computers: discover 29 stocks that are working to make quantum computing a reality.
This article by Simply Wall St is general in nature. We provide commentary based on historical data and analyst forecasts only using an unbiased methodology and our articles are not intended to be financial advice. It does not constitute a recommendation to buy or sell any stock, and does not take account of your objectives, or your financial situation. We aim to bring you long-term focused analysis driven by fundamental data. Note that our analysis may not factor in the latest price-sensitive company announcements or qualitative material. Simply Wall St has no position in any stocks mentioned.
Have feedback on this article? Concerned about the content? Get in touch with us directly. Alternatively, email editorial-team@simplywallst.com