
- PREMIUM
- LIVE QUOTES
- INSTITUTIONS
 Index Options
 State Street
 CME Group
 Nasdaq
 Cboe
Cboe TradingView
 Wall Street Journal
Is KB Home (KBH) Pricing Reflect Recent Share Weakness Or Future Earnings Potential
- If you are wondering whether KB Home's current share price lines up with its underlying value, this article will walk you through the key signals to watch.
- The stock last closed at US$57.19, with returns of 0.4% over 7 days, a 9.7% decline over 30 days, a 0.2% gain year to date, and a 9.8% decline over 1 year, set against much stronger 3 year and 5 year returns of 71.7% and 80.9% respectively.
- These mixed returns can reflect shifting expectations around the housing market, interest rates, and investor appetite for homebuilder stocks. Together, they frame KB Home as a company where sentiment has cooled recently after a stronger multi year run.
- KB Home currently has a valuation score of 3/6, suggesting it screens as undervalued on half of the checks we will walk through next. We will also look at a broader way to think about value that goes beyond any single model by the end of the article.
Find out why KB Home's -9.8% return over the last year is lagging behind its peers.
Approach 1: KB Home Discounted Cash Flow (DCF) Analysis
A Discounted Cash Flow, or DCF, model estimates what a company might be worth today by projecting its future cash flows and discounting them back to a present value using a required rate of return.
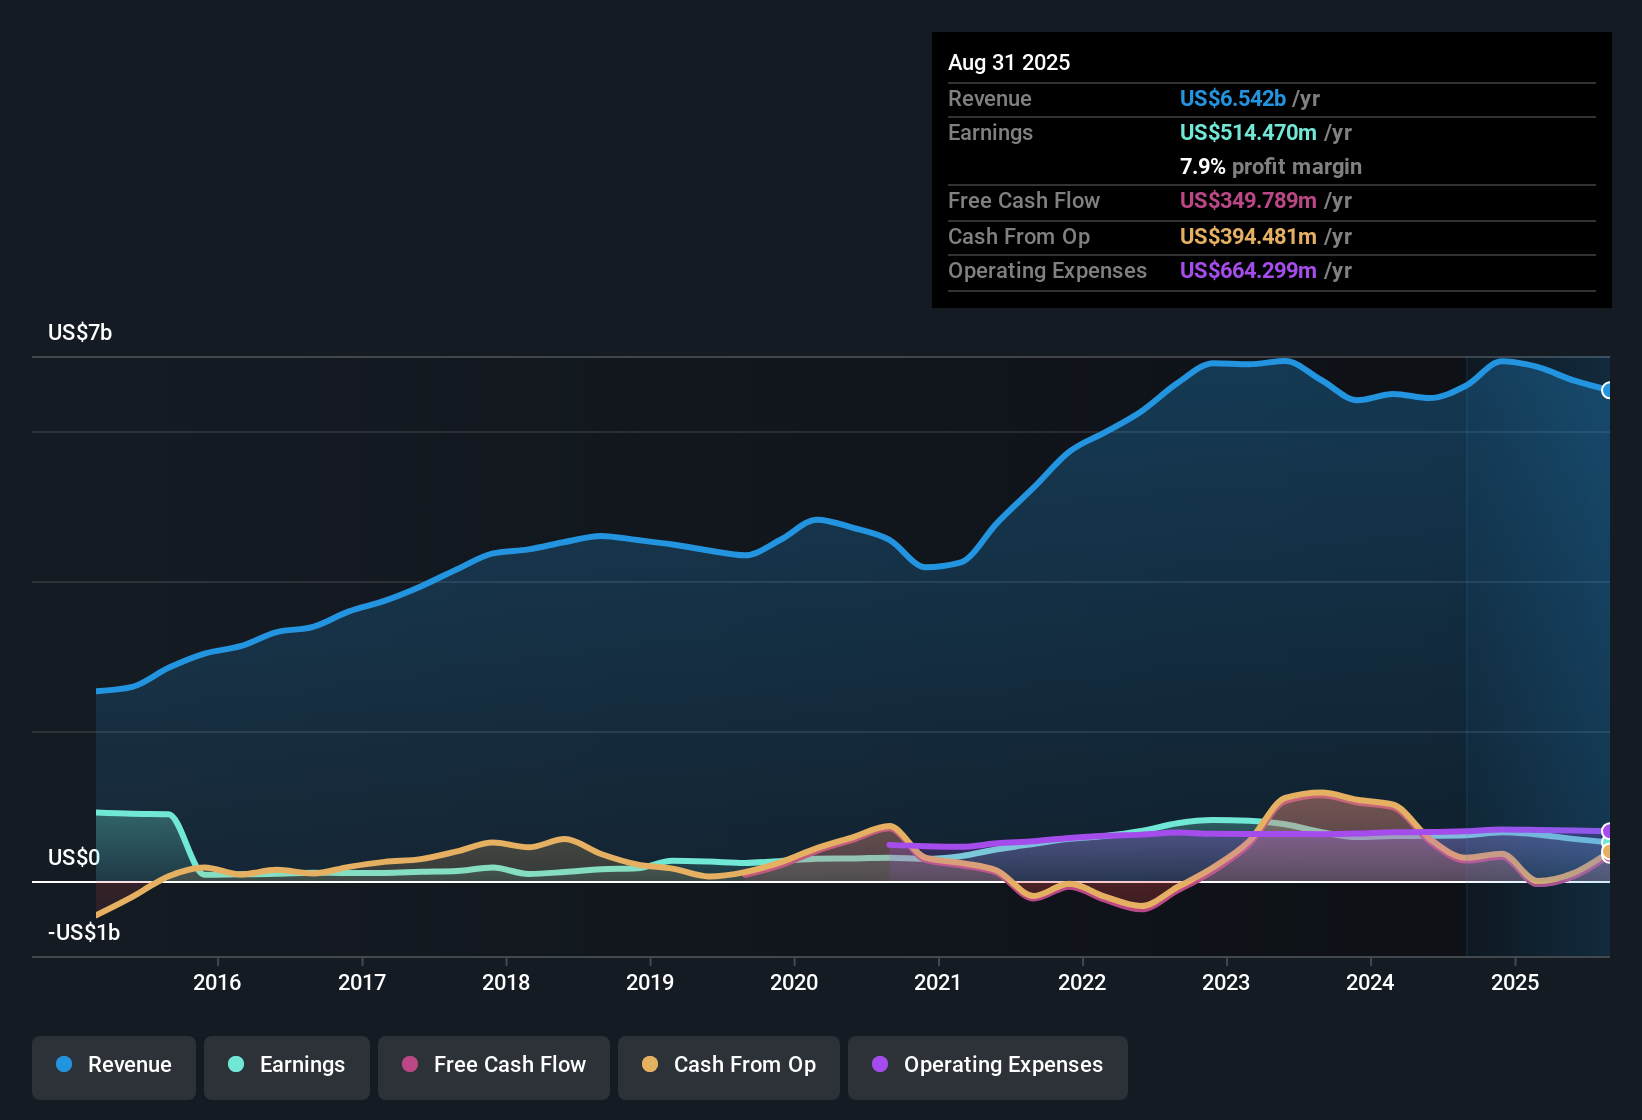
For KB Home, the model used is a 2 Stage Free Cash Flow to Equity approach, based on cash flow projections rather than dividends. The company’s last twelve month free cash flow is about $354.1 million. Analyst inputs and extrapolated estimates point to free cash flow of $318.9 million in 2026 and $186.0 million in 2027, with further projections running out to 2035. Simply Wall St extrapolates beyond the analyst horizon to complete the 10 year path of cash flows.
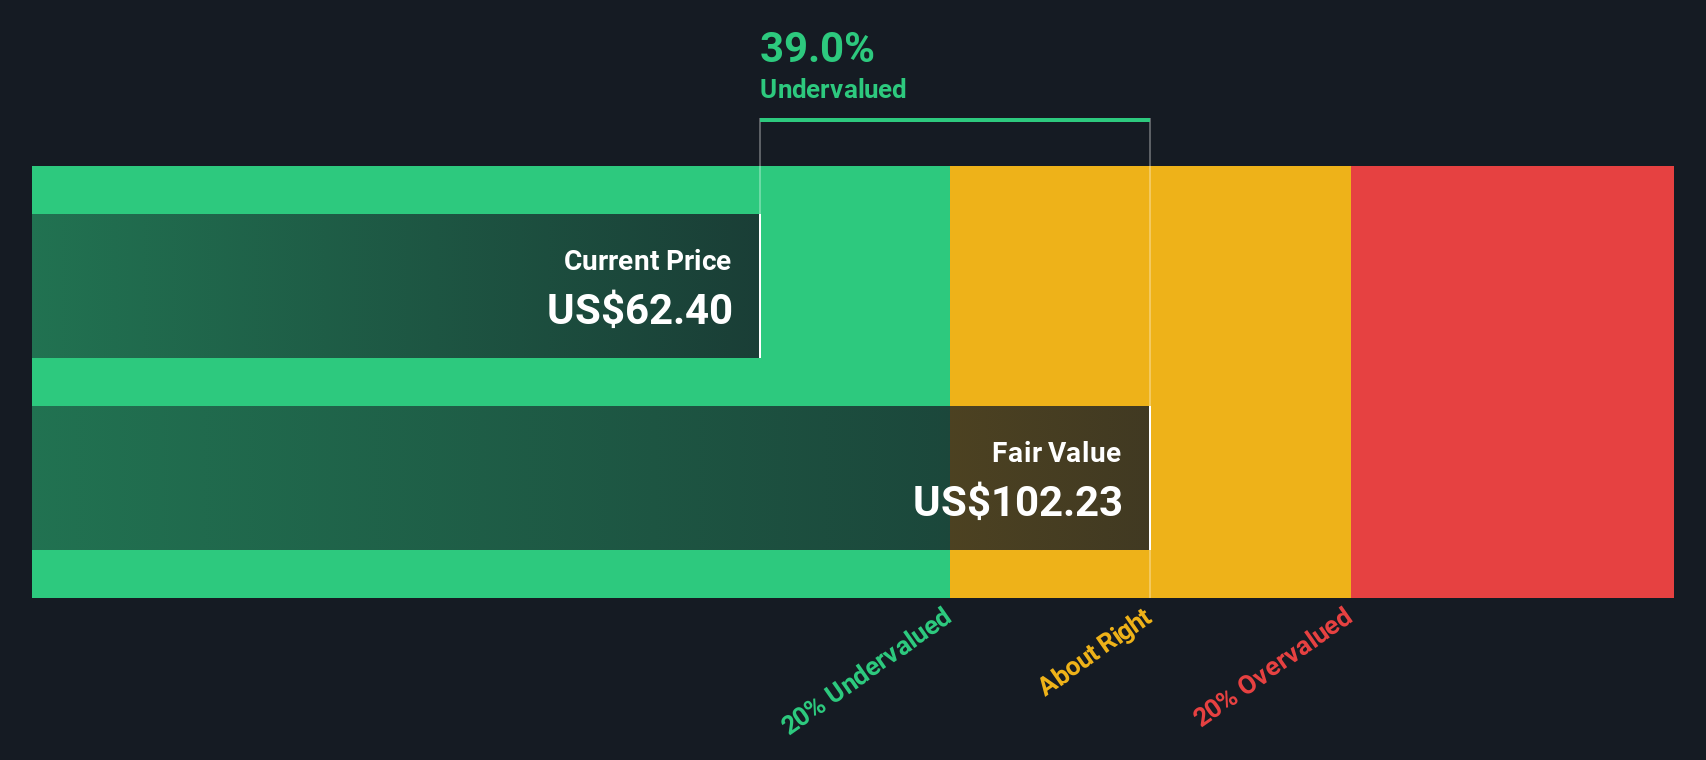
When all those projected cash flows are discounted back and added up, the model arrives at an estimated intrinsic value of about $34.99 per share. Compared with the recent share price of $57.19, this DCF output indicates that, on this measure, KB Home is trading about 63.5% above the model’s intrinsic value estimate.
Result: OVERVALUED
Our Discounted Cash Flow (DCF) analysis suggests KB Home may be overvalued by 63.5%. Discover 877 undervalued stocks or create your own screener to find better value opportunities.
Approach 2: KB Home Price vs Earnings
For profitable companies, the P/E ratio is a useful yardstick because it links what you pay for the stock to the earnings the business is currently generating. Investors usually accept a higher or lower P/E depending on what they expect for future growth and how risky they think those earnings are.
KB Home currently trades on a P/E of 8.4x. That sits below the Consumer Durables industry average P/E of about 10.4x and also below the broader peer group average of 15.4x. On simple comparisons, the stock screens as cheaper than both its sector and peers.
Simply Wall St’s Fair Ratio is a proprietary estimate of what a reasonable P/E might be for KB Home, given factors like its earnings growth profile, industry, profit margins, market cap and company specific risks. This tailored Fair Ratio of 10.9x is designed to be more informative than a blunt peer or industry comparison because it adjusts for the company’s own fundamentals rather than assuming all homebuilders deserve the same multiple. With KB Home trading at 8.4x versus a Fair Ratio of 10.9x, the shares screen as undervalued on this metric.
Result: UNDERVALUED
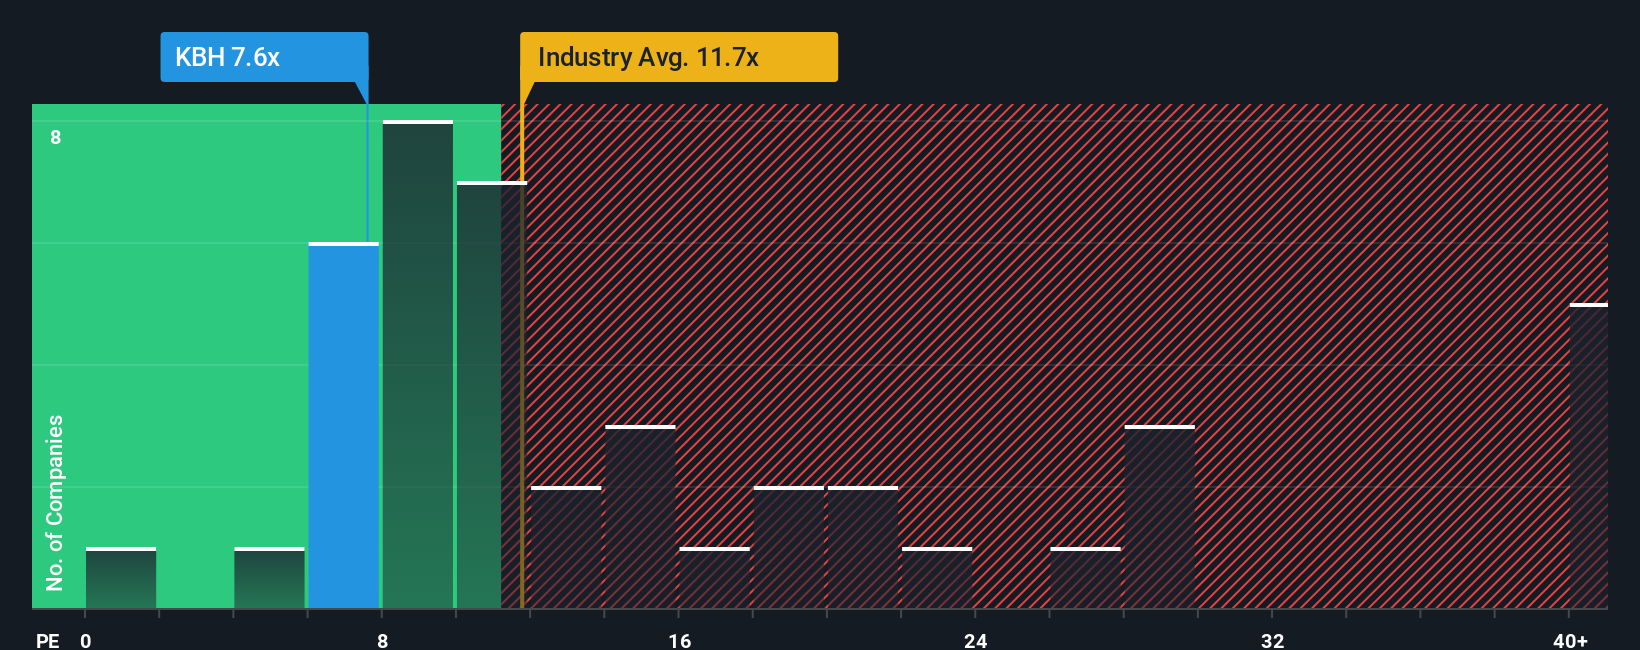
P/E ratios tell one story, but what if the real opportunity lies elsewhere? Discover 1448 companies where insiders are betting big on explosive growth.
Upgrade Your Decision Making: Choose your KB Home Narrative
Earlier we mentioned that there is an even better way to understand valuation. On Simply Wall St’s Community page you can use Narratives, where you connect your story about KB Home to your own forecast for revenue, earnings and margins. You can then link that forecast to a fair value and compare it with the current price to decide whether the stock looks attractive or not. That view updates automatically as new news or earnings arrive. You can also see how different investors land at very different fair values, such as around US$55 at the cautious end and US$86 at the optimistic end of recent analyst targets.
Do you think there's more to the story for KB Home? Head over to our Community to see what others are saying!
This article by Simply Wall St is general in nature. We provide commentary based on historical data and analyst forecasts only using an unbiased methodology and our articles are not intended to be financial advice. It does not constitute a recommendation to buy or sell any stock, and does not take account of your objectives, or your financial situation. We aim to bring you long-term focused analysis driven by fundamental data. Note that our analysis may not factor in the latest price-sensitive company announcements or qualitative material. Simply Wall St has no position in any stocks mentioned.
Have feedback on this article? Concerned about the content? Get in touch with us directly. Alternatively, email editorial-team@simplywallst.com