
- PREMIUM
- LIVE QUOTES
- INSTITUTIONS
 Index Options
 State Street
 CME Group
 Nasdaq
 Cboe
Cboe TradingView
 Wall Street Journal
Is It Too Late To Reassess Oshkosh (OSK) After Its Strong Share Price Rally?
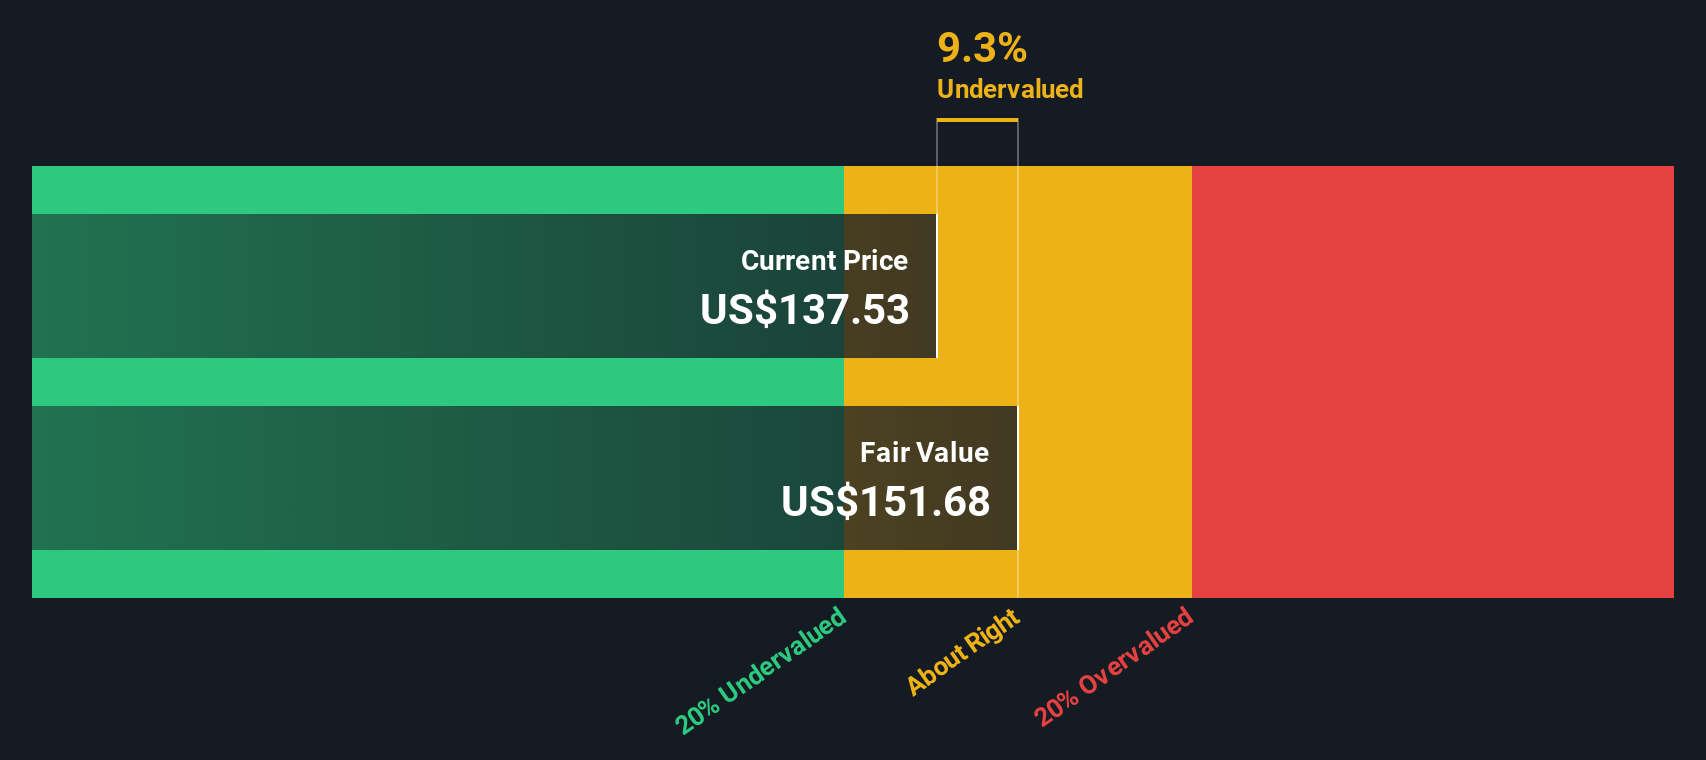
- If you are wondering whether Oshkosh at around US$145 per share still offers value, the key question is how its current price compares with what the business may reasonably be worth.
- The stock has seen strong recent moves, with returns of 14.9% over the last 7 days, 12.4% over the last 30 days, 10.0% year to date and 59.7% over the past year, along with 65.4% over 3 years and 64.4% over 5 years.
- Recent headlines around Oshkosh have focused on the business and its position in the capital goods space, which gives context to the sharp short term price moves. For investors, that news flow is a reminder to separate day to day sentiment from a grounded view of what the company might be worth.
- On our checks, Oshkosh currently has a value score of 5/6, and next we will look at the usual valuation tools like P/E, P/B and discounted cash flow, before finishing with a different way to think about valuation that can be even more useful.
Approach 1: Oshkosh Discounted Cash Flow (DCF) Analysis
A Discounted Cash Flow, or DCF, model estimates what a company might be worth by projecting the cash it could generate in the future and then discounting those cash flows back to today.
For Oshkosh, the model used is a 2 Stage Free Cash Flow to Equity approach based on cash flow projections. The latest twelve month free cash flow is about $683.4 million. Analysts and extrapolated estimates point to free cash flow of $811.0 million in 2028, with a path of projected cash flows out to 2035 provided in millions of dollars.
When these future cash flows are discounted back, the resulting estimated intrinsic value comes out at about $237.73 per share. Against a recent share price around $145, the model implies the stock is trading at a 38.8% discount to this DCF estimate. On this set of assumptions, Oshkosh appears to be undervalued according to the model.
Result: UNDERVALUED
Our Discounted Cash Flow (DCF) analysis suggests Oshkosh is undervalued by 38.8%. Track this in your watchlist or portfolio, or discover 877 more undervalued stocks based on cash flows.
Approach 2: Oshkosh Price vs Earnings
For a profitable company like Oshkosh, the P/E ratio is a useful yardstick because it links what you pay for the stock directly to the earnings the business is generating today. Investors usually accept a higher or lower P/E depending on what they expect for future growth and how risky they perceive those earnings to be, so there is no single “right” number, just a range that can be seen as normal for a given profile.
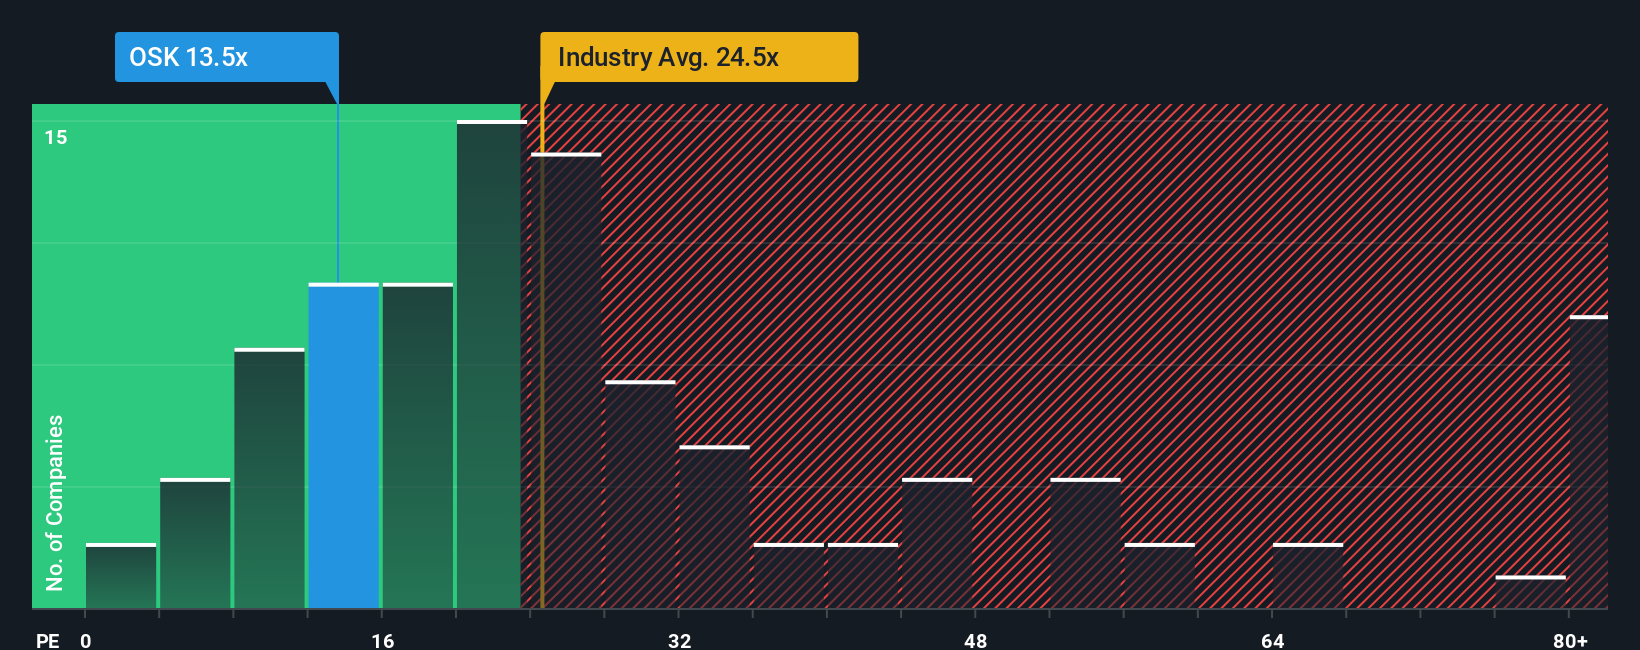
Oshkosh currently trades on a P/E of 13.8x. That sits below the Machinery industry average P/E of about 26.0x and also below a peer group average of 22.1x. To go a step further, Simply Wall St’s “Fair Ratio” framework estimates what an appropriate P/E might be for Oshkosh given factors such as its earnings growth profile, profit margins, industry, market capitalization and risk characteristics.
Because this Fair Ratio is tailored to the company rather than being a blunt comparison with peers or the sector, it can be a more precise reference point. For Oshkosh, the Fair Ratio is 25.9x, which is higher than the current 13.8x P/E and suggests the shares trade below this modelled valuation anchor.
Result: UNDERVALUED
P/E ratios tell one story, but what if the real opportunity lies elsewhere? Discover 1448 companies where insiders are betting big on explosive growth.
Upgrade Your Decision Making: Choose your Oshkosh Narrative
Earlier we mentioned that there is an even better way to understand valuation. On Simply Wall St you can use Narratives on the Community page to tell your story for Oshkosh by linking your assumptions about future revenue, earnings, margins and fair value to a clear forecast. You can then compare that Fair Value to today’s price, see it update automatically when fresh news or earnings arrive, and weigh different perspectives, such as one investor who sees Oshkosh closer to US$188 per share and another who anchors nearer to US$119, to decide how your own view fits between those extremes.
Do you think there's more to the story for Oshkosh? Head over to our Community to see what others are saying!

This article by Simply Wall St is general in nature. We provide commentary based on historical data and analyst forecasts only using an unbiased methodology and our articles are not intended to be financial advice. It does not constitute a recommendation to buy or sell any stock, and does not take account of your objectives, or your financial situation. We aim to bring you long-term focused analysis driven by fundamental data. Note that our analysis may not factor in the latest price-sensitive company announcements or qualitative material. Simply Wall St has no position in any stocks mentioned.
Have feedback on this article? Concerned about the content? Get in touch with us directly. Alternatively, email editorial-team@simplywallst.com