
- PREMIUM
- LIVE QUOTES
- INSTITUTIONS
 Index Options
 State Street
 CME Group
 Nasdaq
 Cboe
Cboe TradingView
 Wall Street Journal
Is Novo Nordisk (CPSE:NOVO B) Pricing Reflect Recent Share Swings Accurately
- If you are wondering whether Novo Nordisk shares still justify their current price, or if the recent buzz has pushed them too far, this article breaks down what the numbers say about value.
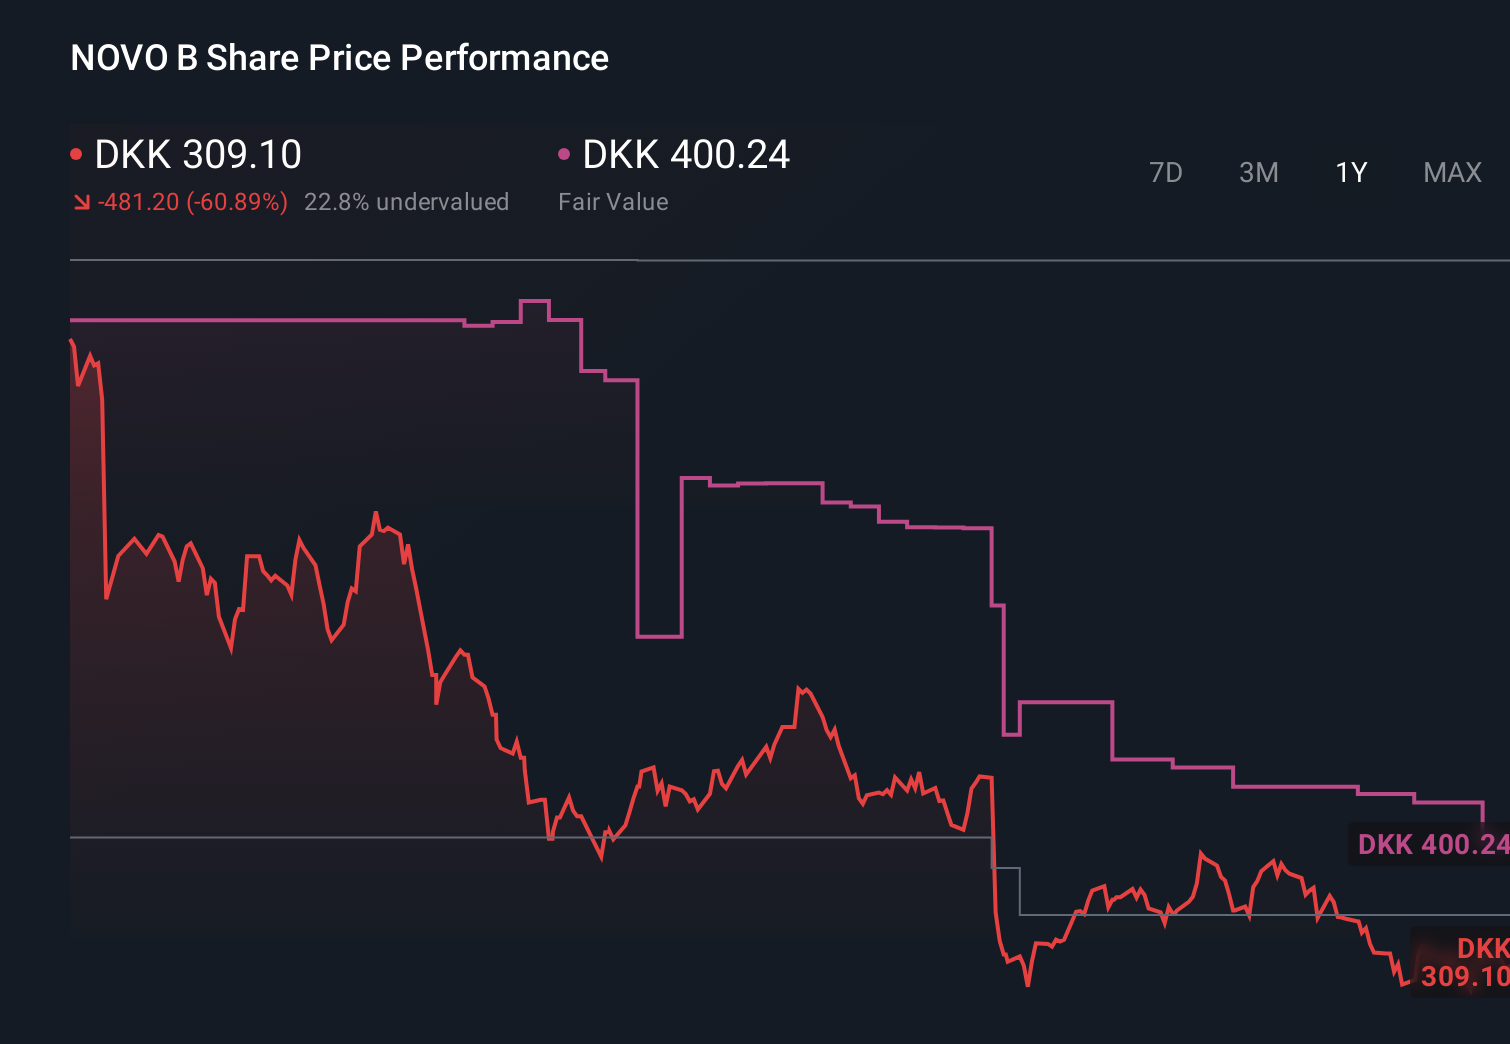
- The stock last closed at kr364.05, with returns of 11.9% over 7 days and 17.6% over 30 days, while the 1 year return stands at a 37.9% decline and the 5 year return at 86.3%.
- Recent coverage around Novo Nordisk has continued to focus on its role in the global pharmaceuticals and biotech sector, keeping investor attention on how its market position is reflected in the share price. This ongoing attention helps frame whether the recent price swings line up with the broader story around the company.
- Novo Nordisk currently scores 5 out of 6 on our valuation checks, which suggests that several traditional methods point to potential undervaluation. Next we will compare these approaches before looking at a more complete way to think about what the stock could be worth.
Find out why Novo Nordisk's -37.9% return over the last year is lagging behind its peers.
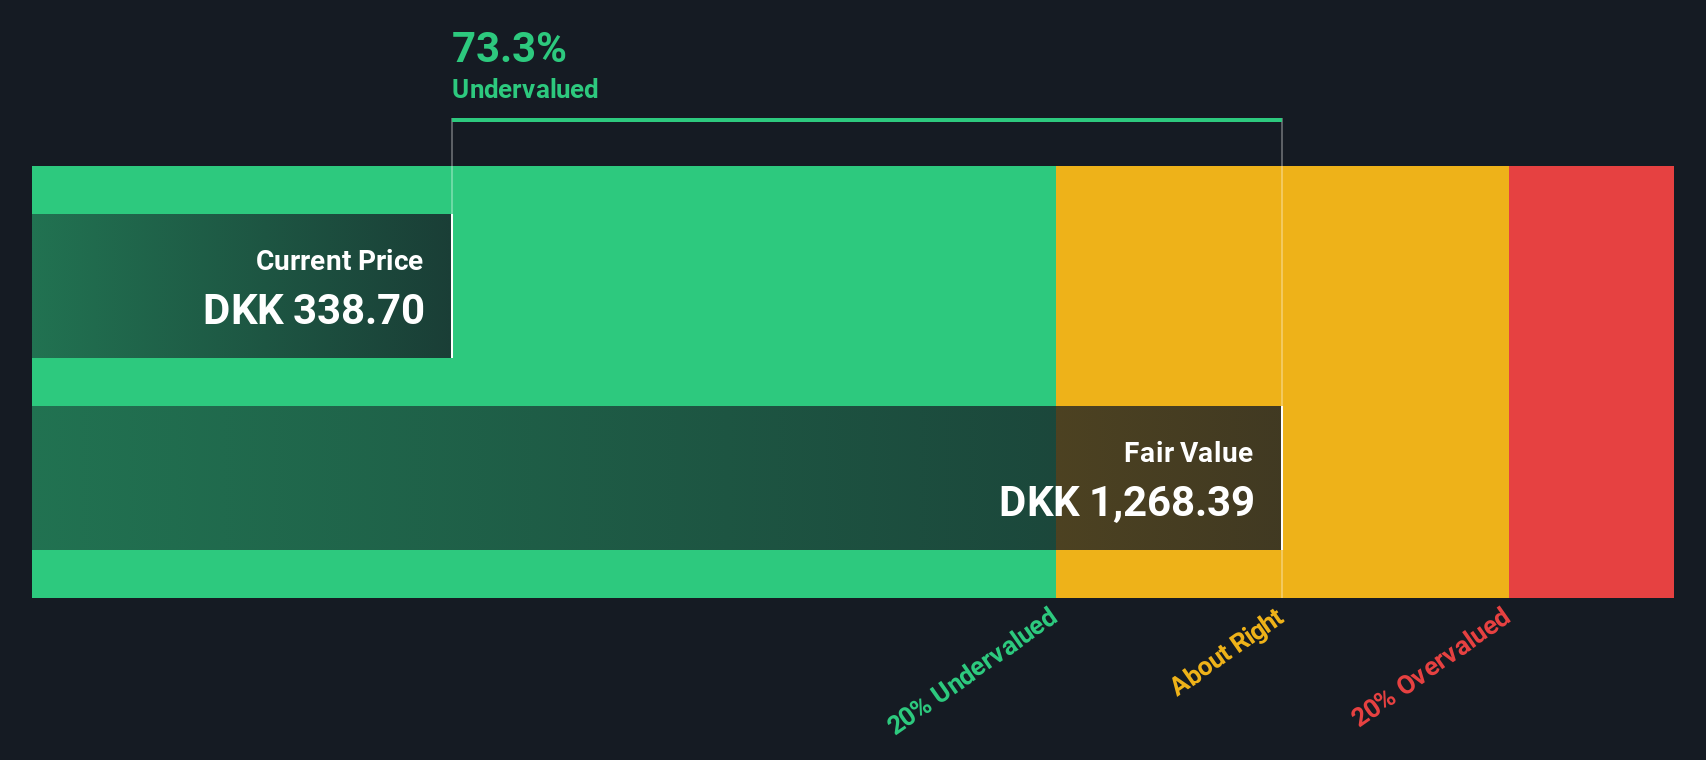
Approach 1: Novo Nordisk Discounted Cash Flow (DCF) Analysis
A Discounted Cash Flow, or DCF, model estimates what a company could be worth by projecting its future cash flows and discounting them back to today. It is essentially asking what all those future DKK cash flows are worth in present terms.
For Novo Nordisk, the latest twelve month free cash flow is DKK 67.6b. Analysts supply free cash flow estimates for the next few years, and beyond that, Simply Wall St extrapolates to extend the forecast. In this model, projected free cash flow reaches DKK 145.5b by 2030, with interim yearly projections between 2026 and 2035 discounted back to today using a 2 Stage Free Cash Flow to Equity approach.
Adding those discounted cash flows together produces an estimated intrinsic value of DKK 1,049.09 per share. Against the recent share price of DKK 364.05, the model implies that the stock trades at a 65.3% discount to this estimate, which indicates meaningful potential undervaluation based purely on these cash flow assumptions.
Result: UNDERVALUED
Our Discounted Cash Flow (DCF) analysis suggests Novo Nordisk is undervalued by 65.3%. Track this in your watchlist or portfolio, or discover 877 more undervalued stocks based on cash flows.
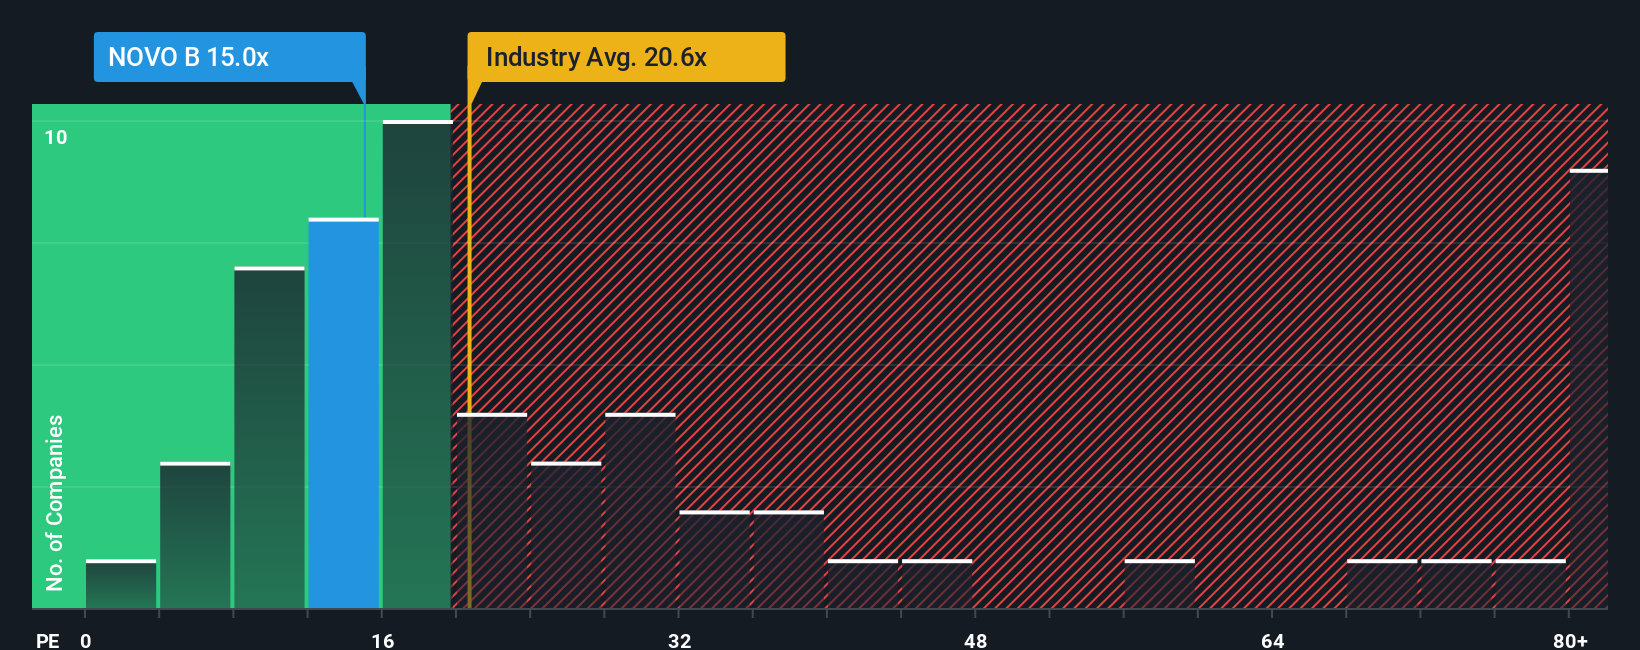
Approach 2: Novo Nordisk Price vs Earnings
For profitable companies like Novo Nordisk, the P/E ratio is a common way to think about value because it links what you are paying directly to current earnings. A higher or lower P/E often reflects what the market is baking in for future growth and how risky those earnings are perceived to be.
Stronger expected earnings growth or lower perceived risk can justify a higher P/E, while slower growth or higher uncertainty usually points to a lower, more cautious multiple. Novo Nordisk currently trades on a P/E of 15.59x. That sits below the Pharmaceuticals industry average of 22.73x and also below the peer group average of 26.62x.
Simply Wall St’s Fair Ratio is an attempt to refine this comparison. It estimates what a “normal” P/E could look like for Novo Nordisk specifically, given factors such as its earnings growth profile, industry, profit margins, market cap and risk characteristics, rather than relying only on broad peer or industry averages. In this case, the Fair Ratio is 27.58x, compared with the current 15.59x. On this metric, Novo Nordisk screens as trading below the P/E level implied by those fundamentals.
Result: UNDERVALUED
P/E ratios tell one story, but what if the real opportunity lies elsewhere? Discover 1448 companies where insiders are betting big on explosive growth.
Upgrade Your Decision Making: Choose your Novo Nordisk Narrative
Earlier we mentioned that there is an even better way to think about valuation, and on Simply Wall St this comes through Narratives. With Narratives, you set out your story for Novo Nordisk, translate that story into explicit assumptions about future revenue, earnings, margins and fair value, and then see it all quantified in a forecast that sits on the Community page. This allows you to compare your own fair value against the current price, watch it update automatically as new news or earnings come in, and see how different investors can look at the same company in very different ways. For example, one Narrative for Novo Nordisk currently points to a fair value of about DKK 851 per share, while another points to about DKK 393 per share. This illustrates how the same stock can look very cheap or fairly valued depending on the story and numbers you believe.
Do you think there's more to the story for Novo Nordisk? Head over to our Community to see what others are saying!
This article by Simply Wall St is general in nature. We provide commentary based on historical data and analyst forecasts only using an unbiased methodology and our articles are not intended to be financial advice. It does not constitute a recommendation to buy or sell any stock, and does not take account of your objectives, or your financial situation. We aim to bring you long-term focused analysis driven by fundamental data. Note that our analysis may not factor in the latest price-sensitive company announcements or qualitative material. Simply Wall St has no position in any stocks mentioned.
Have feedback on this article? Concerned about the content? Get in touch with us directly. Alternatively, email editorial-team@simplywallst.com