
- PREMIUM
- LIVE QUOTES
- INSTITUTIONS
 Index Options
 State Street
 CME Group
 Nasdaq
 Cboe
Cboe TradingView
 Wall Street Journal
Is It Too Late To Consider Robinhood Markets (HOOD) After A 200% One Year Surge?
- If you are wondering whether Robinhood Markets at around US$121.70 is priced for more growth or already reflecting the story, you are in the right place to scrutinize what that tag might really imply.
- The stock has moved 5.4% over the last week, a 7.8% decline over 30 days, 5.6% year to date, and a 200.0% return over the past year, which raises questions about how much of the story is already in the price and how much risk you are now taking on.
- Recent commentary around Robinhood has centered on its role as a trading gateway for retail investors and its position within app based brokerage. There is debate over how those trends feed into its long term business profile. That backdrop provides useful context when you look at a share price that has already delivered a very large gain of about 13x over three years.
- Right now, Robinhood scores 1 out of 6 on our valuation checks. This suggests it screens as undervalued on only one measure. You can see the breakdown in more detail in our valuation score, which we will unpack using several common models before finishing with a more rounded way to think about what the stock might be worth.
Robinhood Markets scores just 1/6 on our valuation checks. See what other red flags we found in the full valuation breakdown.
Approach 1: Robinhood Markets Excess Returns Analysis
The Excess Returns model looks at how much profit a company can earn above its cost of equity and then capitalizes those extra profits into a per share value today. It focuses less on short term swings and more on how efficiently equity is used over time.
For Robinhood Markets, the model starts with a Book Value of $9.53 per share and a Stable EPS estimate of $2.79 per share, based on weighted future Return on Equity inputs from 8 analysts. The average Return on Equity used is 21.01%, while the Cost of Equity is $1.12 per share, which leaves an Excess Return of $1.67 per share. The Stable Book Value is set at $13.27 per share, sourced from future Book Value estimates from 5 analysts.
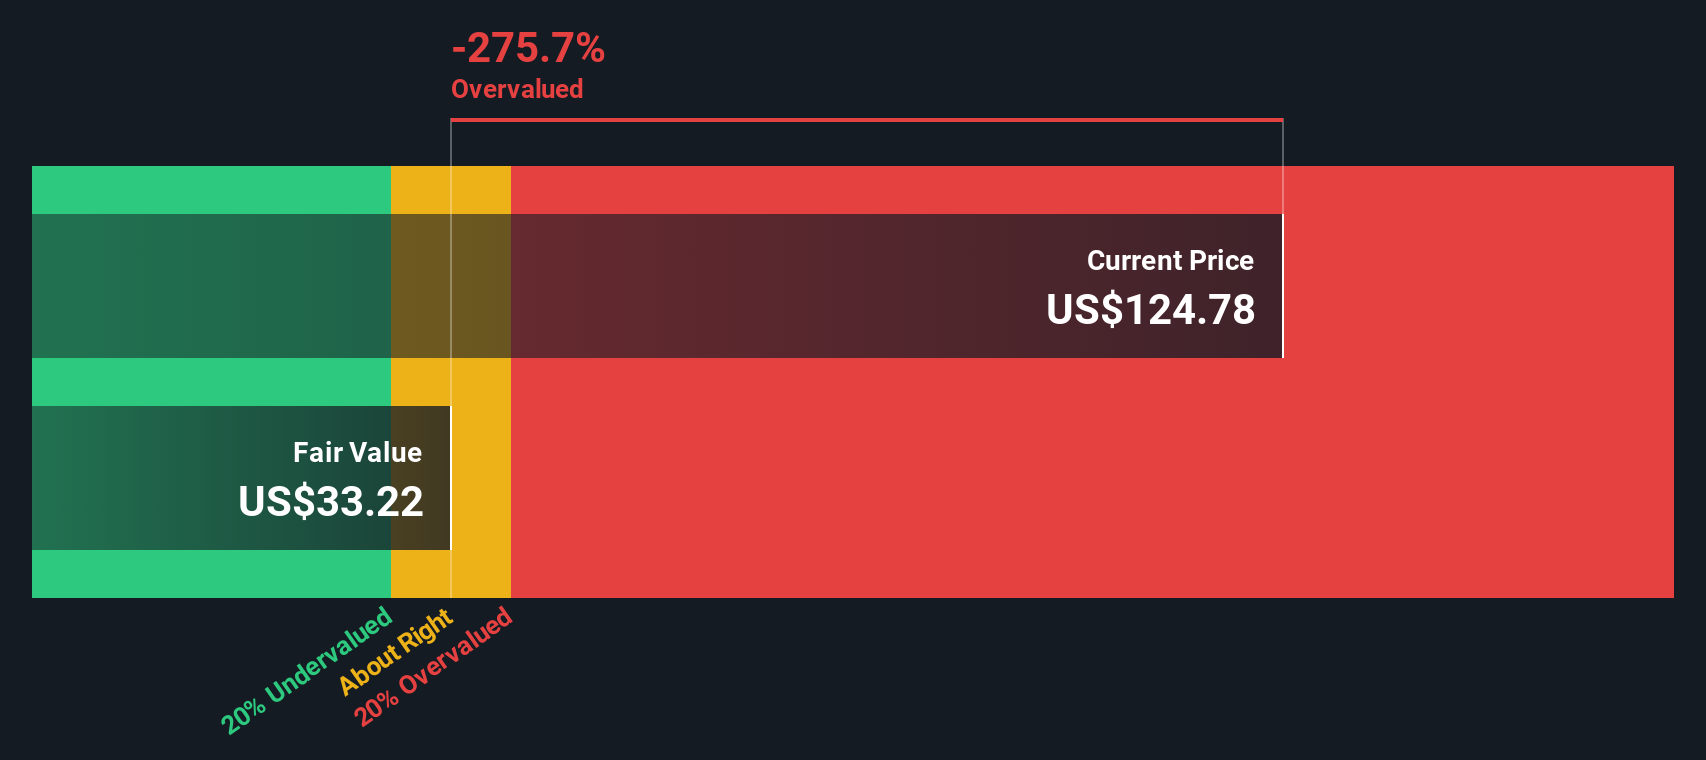
Combining these inputs, the Excess Returns approach produces an intrinsic value of about $45.38 per share. Compared with the current share price of around $121.70, this framework suggests Robinhood is 168.2% overvalued on this metric.
Result: OVERVALUED
Our Excess Returns analysis suggests Robinhood Markets may be overvalued by 168.2%. Discover 877 undervalued stocks or create your own screener to find better value opportunities.
Approach 2: Robinhood Markets Price vs Earnings
For a profitable business, the P/E ratio is a useful shorthand because it connects what you pay for each share with the earnings that support that price. It lets you quickly see how many dollars investors are paying for each dollar of current earnings.
What counts as a “normal” P/E depends on how the market views a company’s growth prospects and risk. Higher expected growth or perceived resilience can support a higher multiple, while more uncertainty or lower growth usually lines up with a lower P/E.
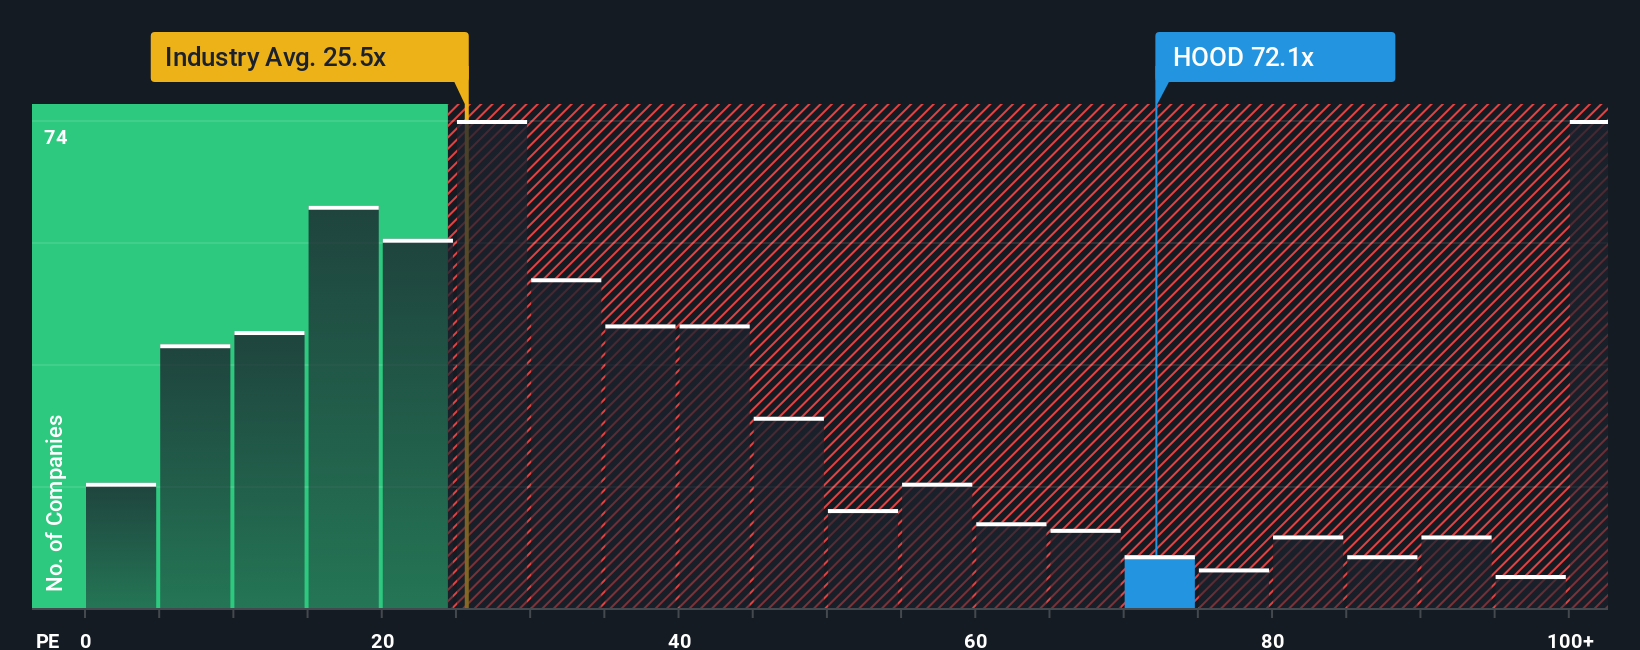
Robinhood Markets currently trades on a P/E of 49.88x. That sits above the Capital Markets industry average of 25.75x and also above the peer average of 28.80x. Simply Wall St’s “Fair Ratio” for Robinhood is 26.67x, which is its proprietary estimate of an appropriate P/E once factors like earnings growth, industry, profit margin, market cap and company specific risks are taken into account.
Because the Fair Ratio is tailored to the company, it can be more informative than a simple comparison with industry or peer averages that may not share the same profile. Set against this 26.67x Fair Ratio, the current 49.88x P/E suggests the shares are trading at a richer level than that model implies.
Result: OVERVALUED
P/E ratios tell one story, but what if the real opportunity lies elsewhere? Discover 1448 companies where insiders are betting big on explosive growth.
Upgrade Your Decision Making: Choose your Robinhood Markets Narrative
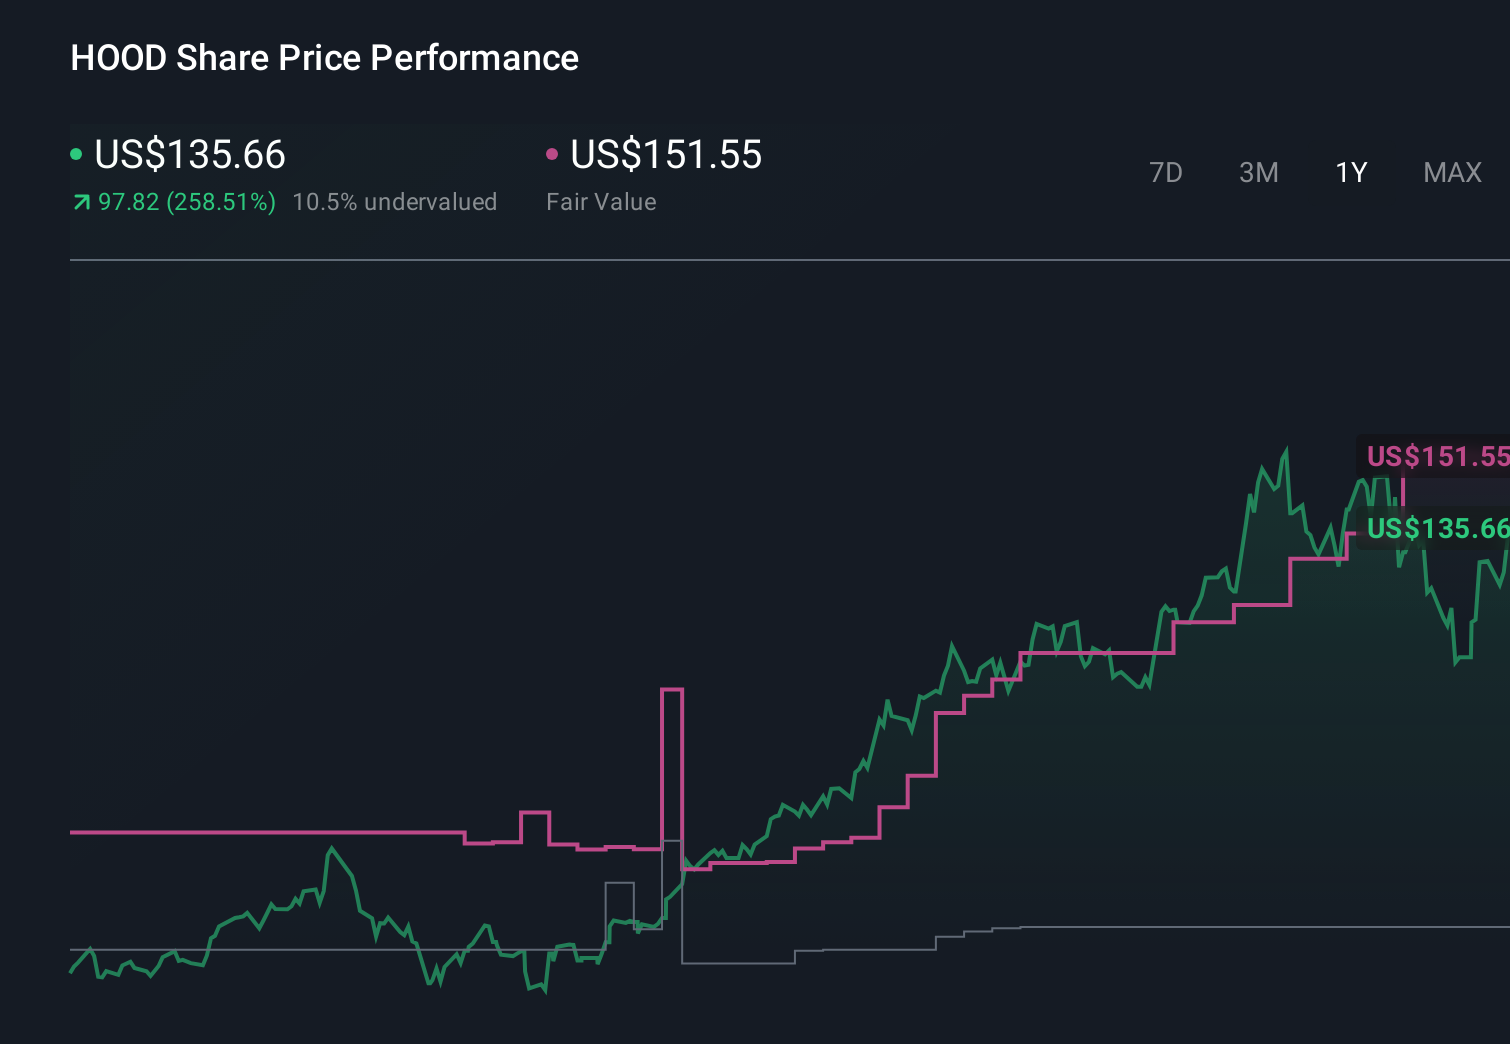
Earlier we mentioned that there is an even better way to think about valuation, and on Simply Wall St that starts with Narratives. You set out your story for Robinhood Markets, link that story to your own revenue, earnings and margin assumptions, see how those roll into a fair value on the Community page, compare that fair value with the live price to help you decide whether to buy or sell, and watch it all update automatically when fresh news or earnings arrive. One investor might build a Robinhood Narrative that leans toward the higher analyst fair value of about US$151.55 with a future P/E near 74.15x, while a more cautious investor might anchor closer to the lower price target of US$50. Yet both are using the same simple tool to connect their view of the business to the numbers on the screen.
Do you think there's more to the story for Robinhood Markets? Head over to our Community to see what others are saying!
This article by Simply Wall St is general in nature. We provide commentary based on historical data and analyst forecasts only using an unbiased methodology and our articles are not intended to be financial advice. It does not constitute a recommendation to buy or sell any stock, and does not take account of your objectives, or your financial situation. We aim to bring you long-term focused analysis driven by fundamental data. Note that our analysis may not factor in the latest price-sensitive company announcements or qualitative material. Simply Wall St has no position in any stocks mentioned.
Have feedback on this article? Concerned about the content? Get in touch with us directly. Alternatively, email editorial-team@simplywallst.com