
- PREMIUM
- LIVE QUOTES
- INSTITUTIONS
 Index Options
 State Street
 CME Group
 Nasdaq
 Cboe
Cboe TradingView
 Wall Street Journal
Is Capgemini (ENXTPA:CAP) Offering Value After A 8.7% One Year Share Price Decline
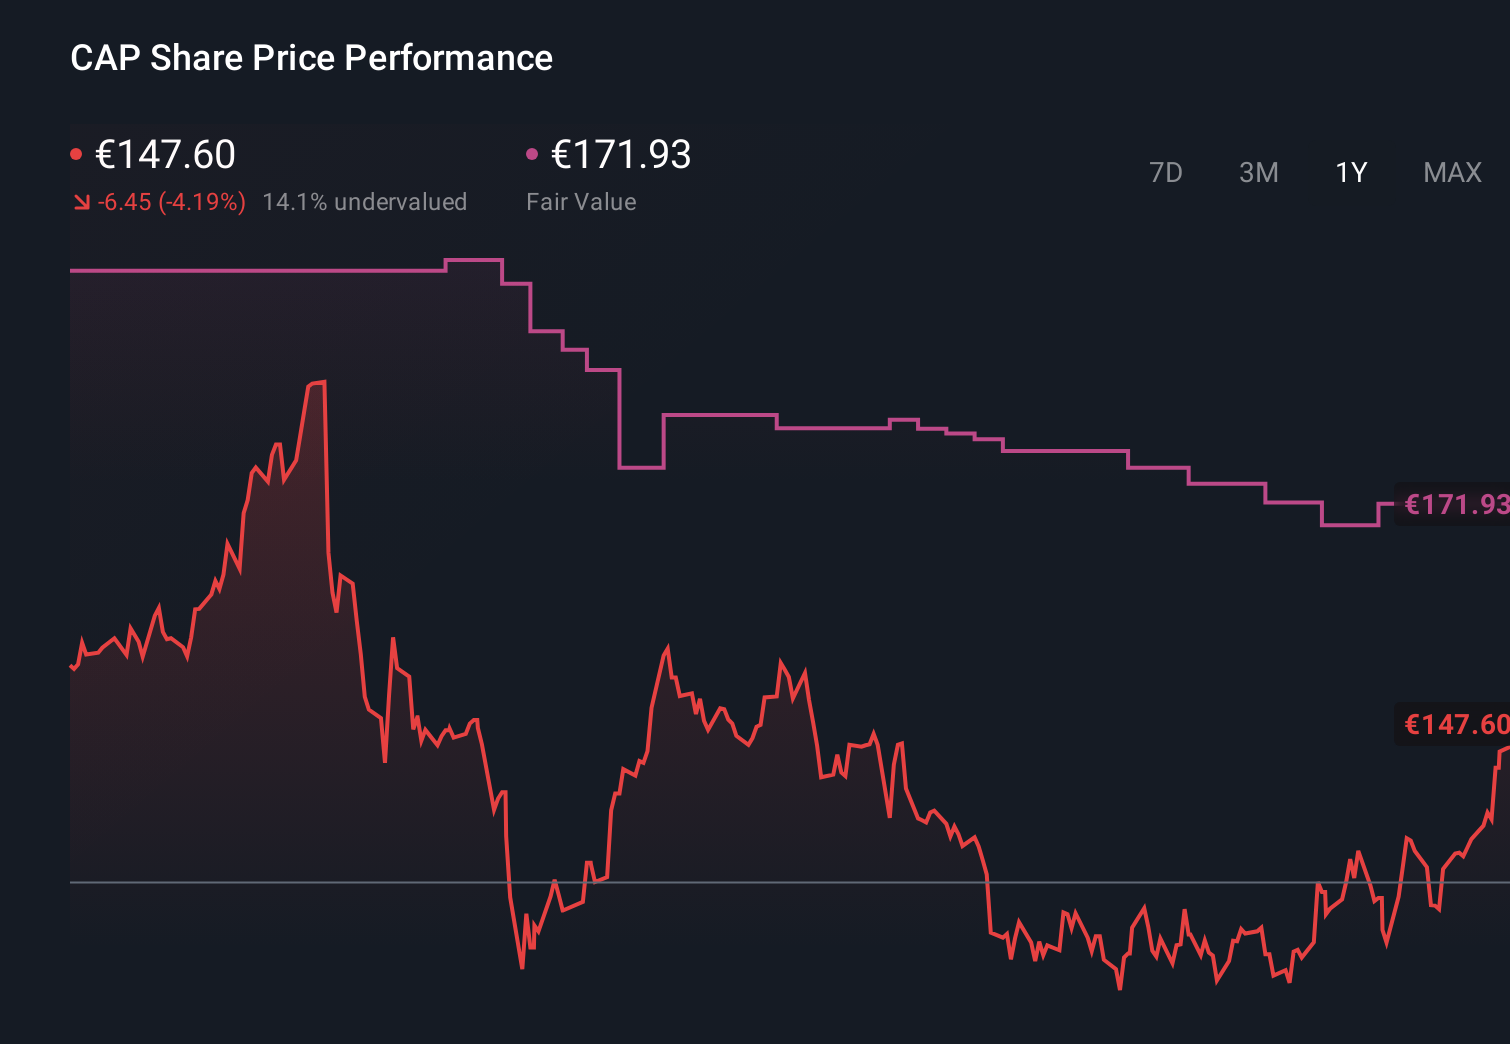
- Wondering whether Capgemini at €143.20 is offering you good value today, or whether the price already reflects most of the upside?
- The share price is at €143.20 after a 0.1% gain over the last week, a 0.9% decline over the last month, a 1.7% gain year to date, and an 8.7% decline over the past year, while the 5 year return sits at 25.8%.
- Recent coverage around Capgemini has focused on its role as a major European IT and consulting group and how that positioning fits into long term digital and technology spending themes. This context helps frame why the stock has seen mixed shorter term returns alongside a stronger 5 year result.
- On our valuation checks, Capgemini records a score of 5/6. This suggests there is more to unpack when you compare different valuation methods, and we will also look at a deeper way to think about what this score means for you by the end of the article.
Find out why Capgemini's -8.7% return over the last year is lagging behind its peers.
Approach 1: Capgemini Discounted Cash Flow (DCF) Analysis
A Discounted Cash Flow, or DCF, model estimates what a company could be worth by projecting the cash it may generate in the future and then discounting those amounts back to today.
For Capgemini, the model used is a 2 Stage Free Cash Flow to Equity approach. The latest twelve month free cash flow (FCF) is about €2.16b. Analysts supply explicit FCF estimates for the earlier years, and Simply Wall St then extends those projections, giving an indicative FCF of €2.78b in 2030, with a full set of discounted projections running through 2035.
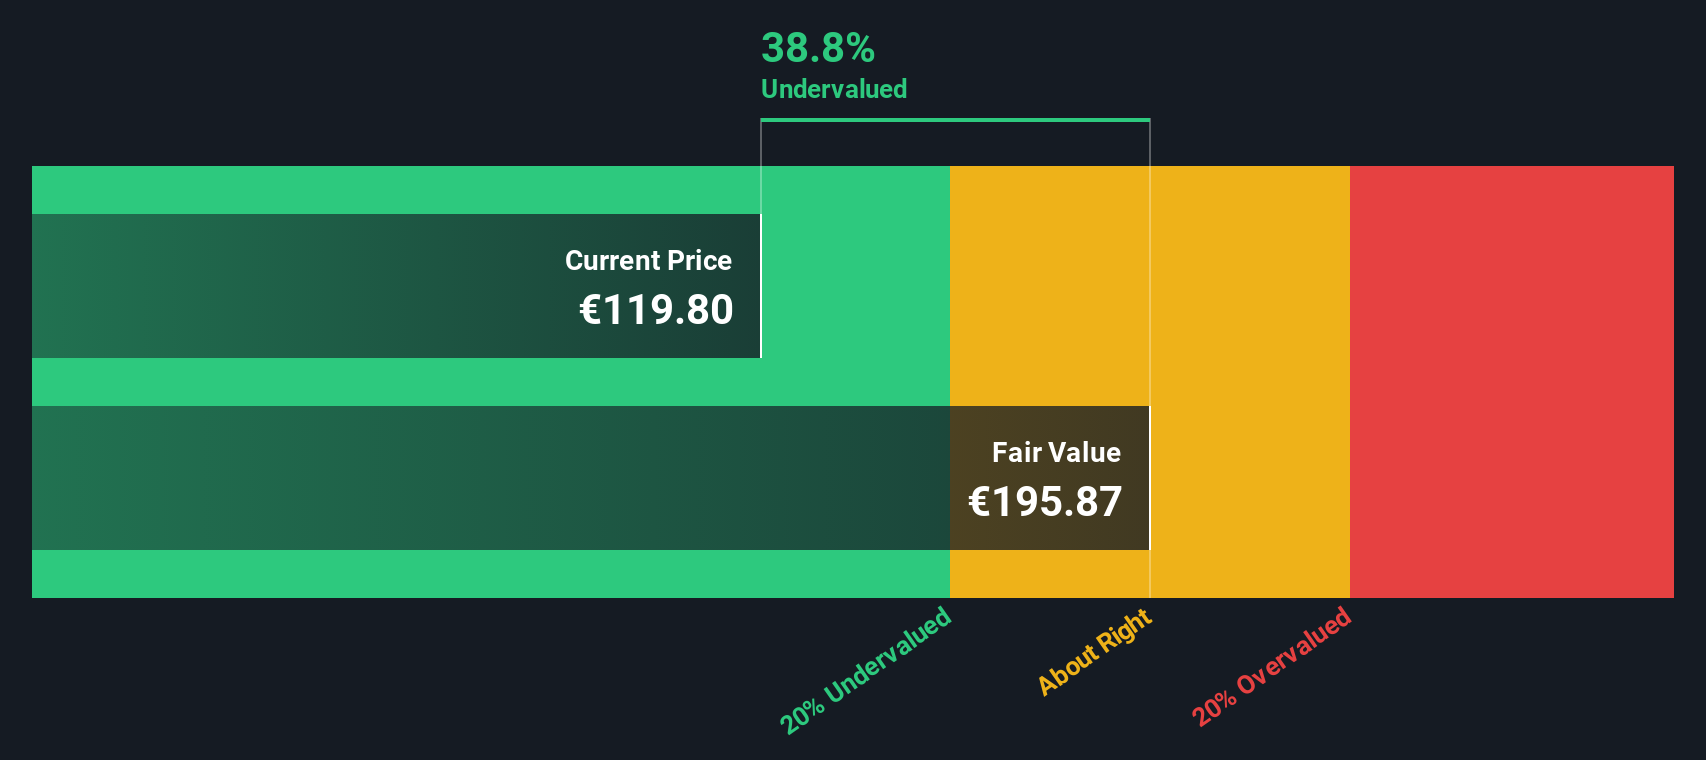
When all those projected cash flows are discounted and added up, the model arrives at an estimated intrinsic value of €216.18 per share. Compared with the current share price of €143.20, the DCF output implies an intrinsic discount of about 33.8%. This suggests the shares are trading below this cash flow based estimate.
Result: UNDERVALUED
Our Discounted Cash Flow (DCF) analysis suggests Capgemini is undervalued by 33.8%. Track this in your watchlist or portfolio, or discover 877 more undervalued stocks based on cash flows.
Approach 2: Capgemini Price vs Earnings
For a profitable company like Capgemini, the P/E ratio is a useful cross check because it relates what you pay directly to the earnings the business is currently generating.
What counts as a normal or fair P/E usually reflects two things: how quickly earnings are expected to grow and how risky those earnings are perceived to be. Higher expected growth or lower risk can justify a higher P/E, while slower growth or higher risk often points to a lower one.
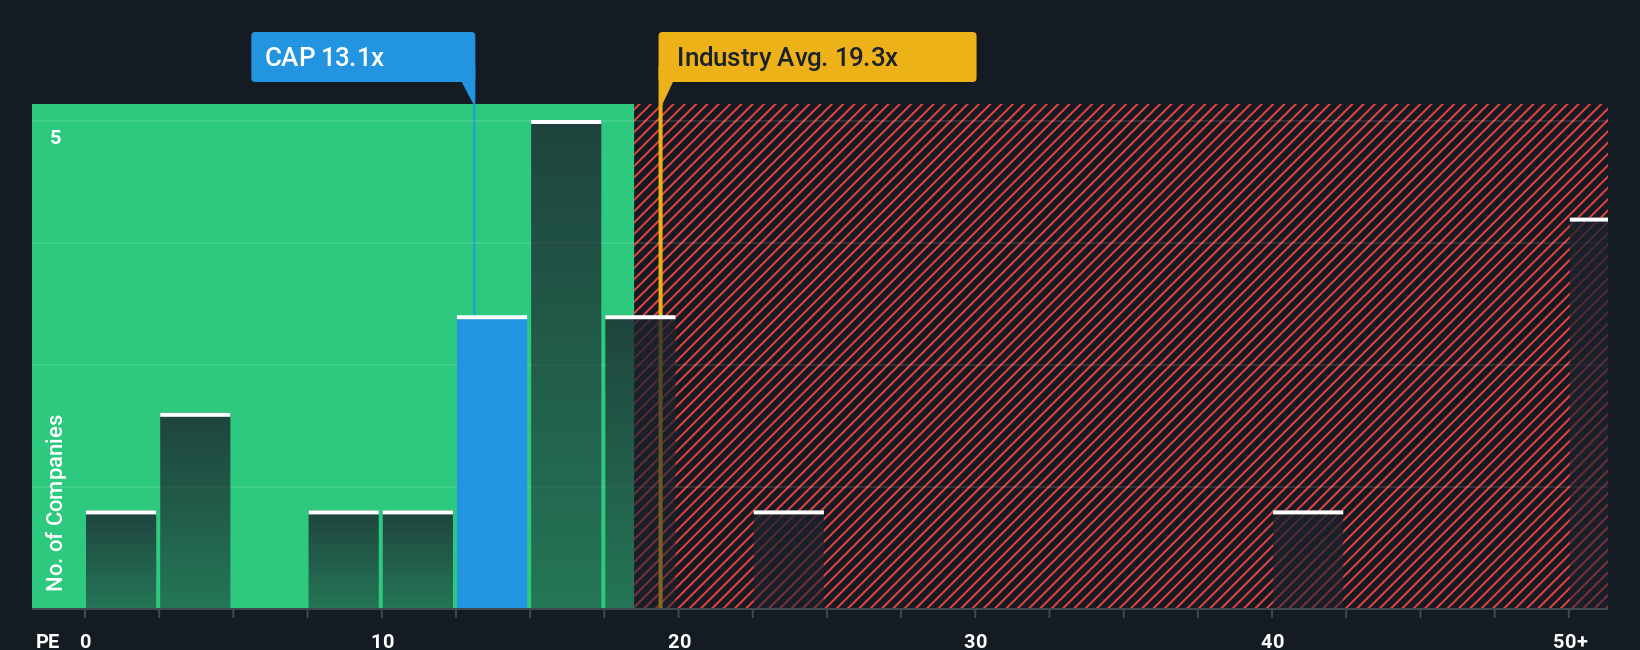
Capgemini currently trades on a P/E of 15.5x. That sits below the IT industry average of 21.6x and above the peer group average of 12.0x. Simply Wall St also calculates a Fair Ratio for Capgemini of 25.2x, which is the P/E it would typically expect given factors like earnings growth, industry, profit margin, market cap and risk profile.
This Fair Ratio can be more informative than a simple peer or industry comparison because it tries to adjust for the specific characteristics of Capgemini rather than treating all IT companies as identical. Compared with the current P/E of 15.5x, the Fair Ratio of 25.2x suggests the shares trade at a discount to this earnings based estimate.
Result: UNDERVALUED
P/E ratios tell one story, but what if the real opportunity lies elsewhere? Discover 1448 companies where insiders are betting big on explosive growth.
Upgrade Your Decision Making: Choose your Capgemini Narrative
Earlier we mentioned that there is an even better way to understand valuation. Let us introduce you to Narratives, which are simple stories you build around Capgemini that connect your view of its business, like how partnerships in AI, sovereign cloud or cybersecurity might affect revenue, earnings and margins, to a concrete forecast and fair value that you can track on Simply Wall St’s Community page. You can then compare this with the current price to help decide whether to hold off, add or trim. You can also see it update automatically when new information such as earnings, guidance changes or analyst targets comes in. A more optimistic Narrative might lean toward something closer to the higher analyst target of €214.0, while a more cautious Narrative might sit nearer the lower target of €134.0, all within an easy, user friendly tool used by millions of investors.
Do you think there's more to the story for Capgemini? Head over to our Community to see what others are saying!
This article by Simply Wall St is general in nature. We provide commentary based on historical data and analyst forecasts only using an unbiased methodology and our articles are not intended to be financial advice. It does not constitute a recommendation to buy or sell any stock, and does not take account of your objectives, or your financial situation. We aim to bring you long-term focused analysis driven by fundamental data. Note that our analysis may not factor in the latest price-sensitive company announcements or qualitative material. Simply Wall St has no position in any stocks mentioned.
Have feedback on this article? Concerned about the content? Get in touch with us directly. Alternatively, email editorial-team@simplywallst.com