
- PREMIUM
- LIVE QUOTES
- INSTITUTIONS
 Index Options
 State Street
 CME Group
 Nasdaq
 Cboe
Cboe TradingView
 Wall Street Journal
Is Aflac (AFL) Still Attractive After Strong Multi Year Share Price Gains
- If you are wondering whether Aflac's current share price offers good value or is starting to look expensive, you are not alone.
- Aflac recently closed at US$111.96, with returns of 1.0% over the last 7 days, 2.5% over 30 days, 1.6% year to date, 11.3% over 1 year, 66.1% over 3 years and 172.3% over 5 years. This naturally raises questions about what is already priced in.
- Recent headlines around Aflac have focused on its position as a major US insurance name and ongoing interest from investors who follow established dividend payers. This context helps explain why the stock's recent performance is drawing fresh attention from both longer term holders and new investors.
- Aflac currently has a valuation score of 3 out of 6, which means it screens as undervalued on half of the checks used. Next, we will look at how different valuation methods line up on the stock before finishing with a way to tie all those signals together.
Approach 1: Aflac Excess Returns Analysis
The Excess Returns model looks at how effectively Aflac turns shareholder equity into profits, then compares those returns with the cost of that equity. In simple terms, it asks whether each dollar of equity is working harder than the return investors require.
For Aflac, book value sits at $54.57 per share, with a stable book value estimate of $57.56 per share, based on weighted future book value estimates from 7 analysts. Stable EPS is $8.10 per share, sourced from weighted future return on equity estimates from 4 analysts, and the average return on equity used in the model is 14.08%.
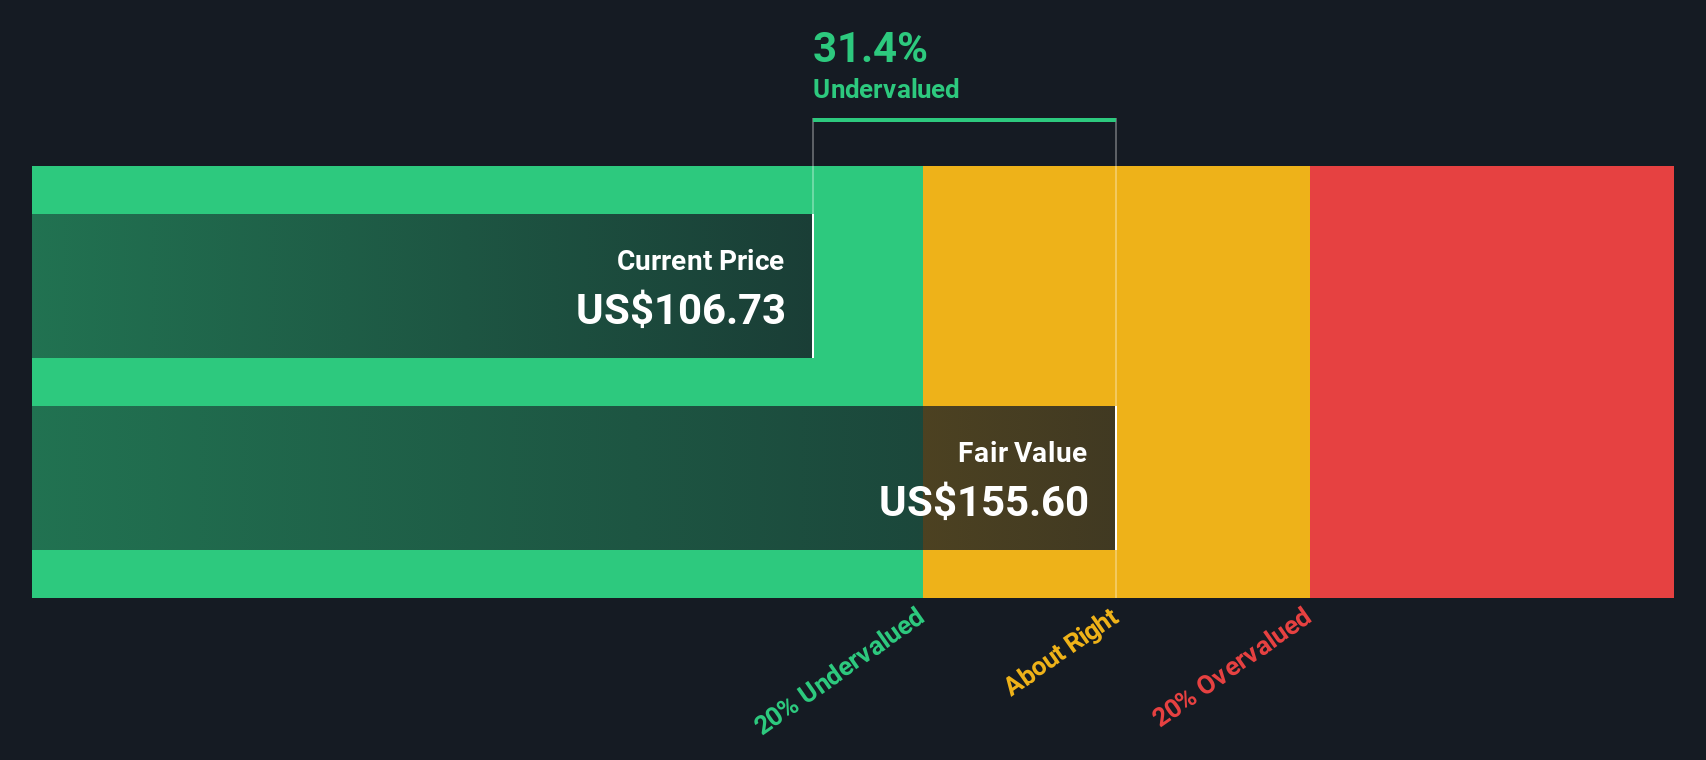
The cost of equity is set at $4.00 per share, while the excess return is $4.10 per share. This means the model assumes earnings per share that are slightly higher than the required return. When these excess returns are projected and capitalized, the model arrives at an intrinsic value of about $168.49 per share.
Compared with the recent share price of US$111.96, this Excess Returns valuation suggests Aflac is 33.6% undervalued.
Result: UNDERVALUED
Our Excess Returns analysis suggests Aflac is undervalued by 33.6%. Track this in your watchlist or portfolio, or discover 877 more undervalued stocks based on cash flows.
Approach 2: Aflac Price vs Earnings
For a profitable company like Aflac, the P/E ratio is a useful way to think about what you are paying for each dollar of earnings. It ties the share price directly to the business’s current earnings power, which is usually a key anchor for investors.
What counts as a “normal” or “fair” P/E depends on how the market views a company’s growth prospects and risk. Higher expected growth or lower perceived risk can justify a higher P/E, while slower growth or higher risk often lines up with a lower P/E.
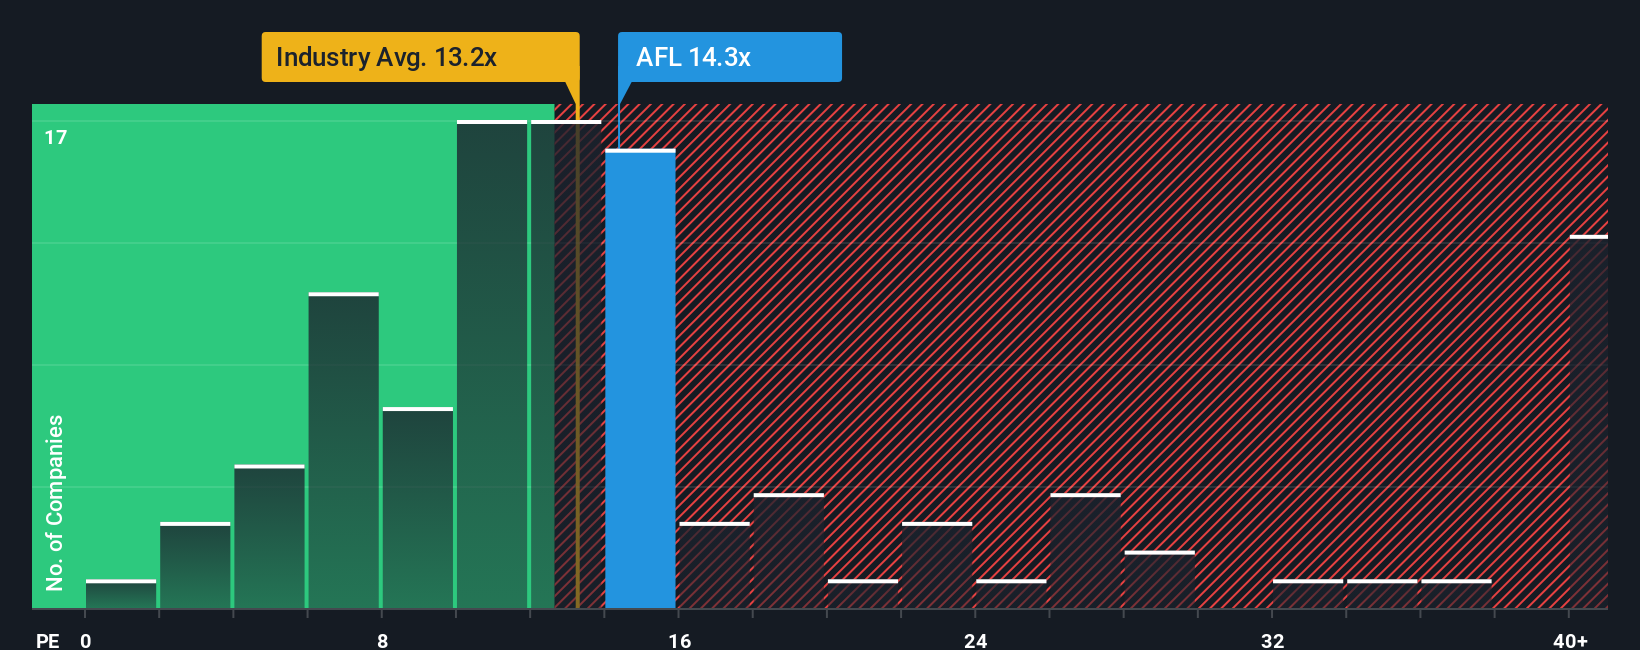
Aflac currently trades on a P/E of 14.08x. That sits slightly above the Insurance industry average of about 12.92x and just below the peer group average of 14.47x. Simply Wall St’s proprietary Fair Ratio for Aflac is 13.26x. This Fair Ratio is designed to be more tailored than a simple peer or industry comparison, because it incorporates factors such as earnings growth, profit margins, risk profile, industry, and market cap.
Putting those together, Aflac’s actual P/E of 14.08x is higher than the Fair Ratio of 13.26x by more than 0.10. This points to the shares screening as slightly expensive on this metric.
Result: OVERVALUED
P/E ratios tell one story, but what if the real opportunity lies elsewhere? Discover 1449 companies where insiders are betting big on explosive growth.
Upgrade Your Decision Making: Choose your Aflac Narrative
Earlier we mentioned that there is an even better way to understand valuation. On Simply Wall St’s Community page you can build or follow “Narratives.” These are simple stories that link your view of Aflac’s business to a forecast for revenue, earnings and margins, and then to a fair value that updates automatically when fresh news or earnings arrive. This lets you compare that fair value with the current share price to decide whether the stock looks attractive, and see how different investors can reasonably disagree. For example, one Narrative may point to a fair value closer to the higher analyst target of US$124.00 and another closer to the lower target of US$99.00.
Do you think there's more to the story for Aflac? Head over to our Community to see what others are saying!

This article by Simply Wall St is general in nature. We provide commentary based on historical data and analyst forecasts only using an unbiased methodology and our articles are not intended to be financial advice. It does not constitute a recommendation to buy or sell any stock, and does not take account of your objectives, or your financial situation. We aim to bring you long-term focused analysis driven by fundamental data. Note that our analysis may not factor in the latest price-sensitive company announcements or qualitative material. Simply Wall St has no position in any stocks mentioned.
Have feedback on this article? Concerned about the content? Get in touch with us directly. Alternatively, email editorial-team@simplywallst.com