
- PREMIUM
- LIVE QUOTES
- INSTITUTIONS
 Index Options
 State Street
 CME Group
 Nasdaq
 Cboe
Cboe TradingView
 Wall Street Journal
Is Sonoco Products (SON) Pricing Look Attractive After Recent Short Term Share Price Strength
- If you are wondering whether Sonoco Products at US$46.39 is offering fair value right now, you are not alone, many investors are asking the same question.
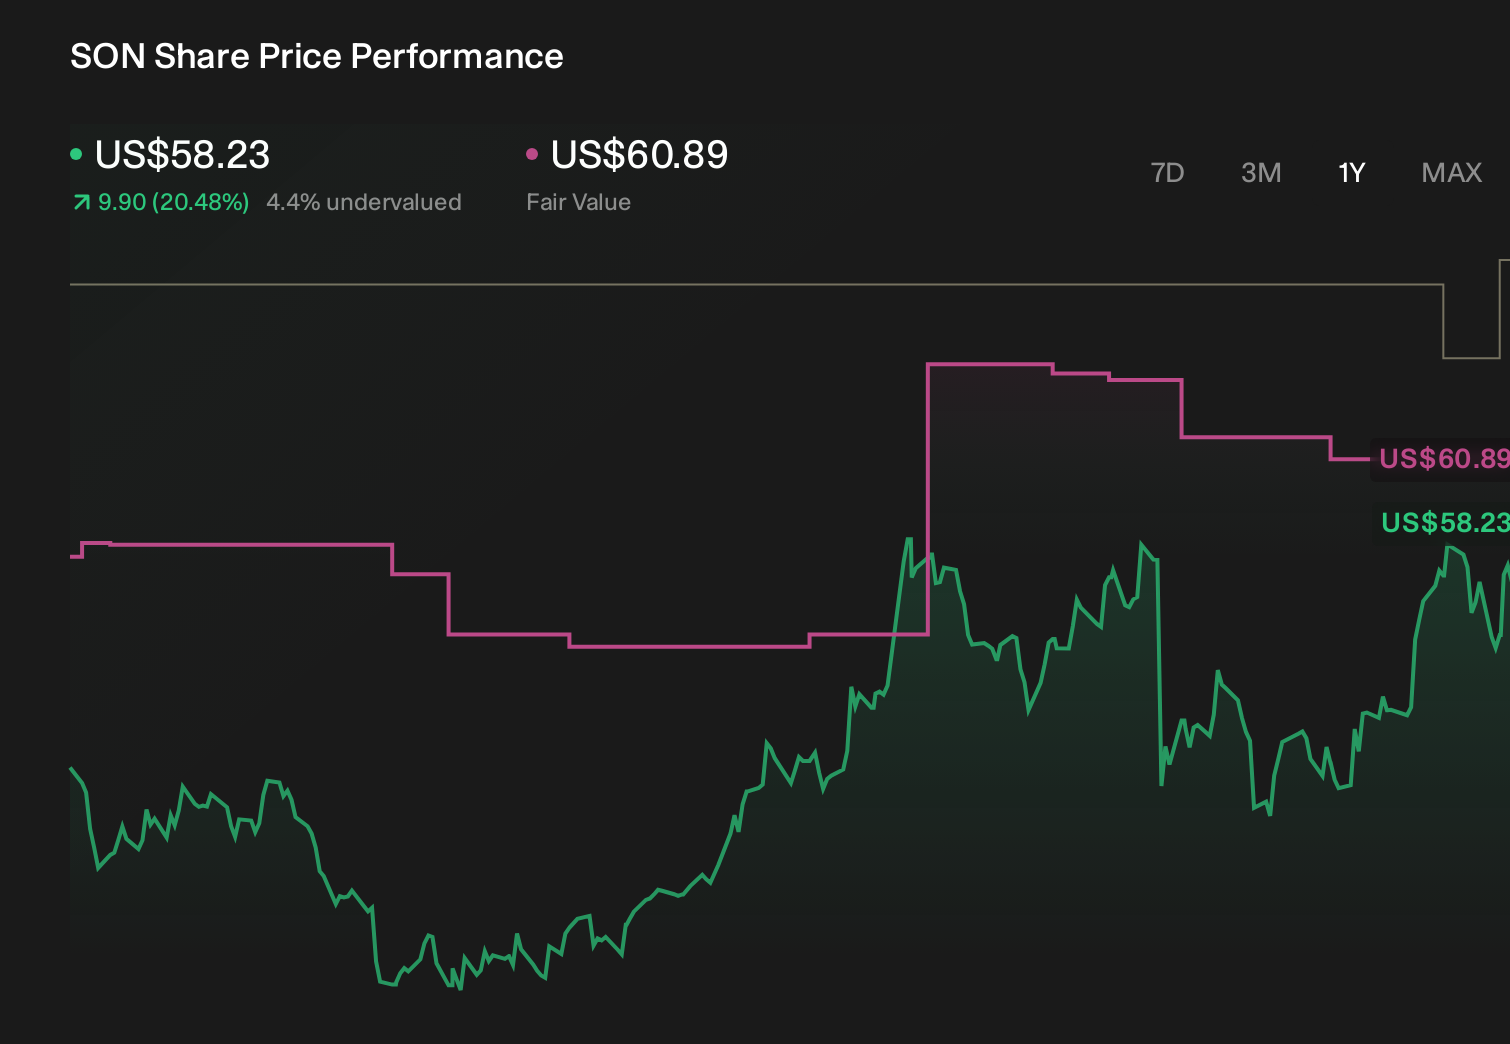
- The share price has moved 6.0% over the last 7 days, 12.0% over the last 30 days, 4.6% year to date, but only 2.6% over the last year, while the 3 year and 5 year returns of 12.4% and 9.7% declines show a much flatter long term picture.
- These mixed return figures have kept attention on Sonoco Products as investors weigh short term momentum against a softer multi year performance. That context makes valuation a key focus, as the recent moves may reflect shifting views on the business rather than any single headline or event.
- On Simply Wall St's valuation checks, Sonoco Products scores 2 out of 6 for being undervalued. You can see this in detail in the valuation score. Next, we will look at what different valuation methods say about the stock, before finishing with a framework that can help you interpret those results more effectively.
Sonoco Products scores just 2/6 on our valuation checks. See what other red flags we found in the full valuation breakdown.
Approach 1: Sonoco Products Discounted Cash Flow (DCF) Analysis
A Discounted Cash Flow, or DCF model, estimates what a company might be worth by taking its projected future cash flows and discounting them back to today in dollar terms. For Sonoco Products, the model used is a 2 Stage Free Cash Flow to Equity approach.
The latest twelve month Free Cash Flow is $242.13 million. Analysts provide detailed Free Cash Flow estimates for several years, and Simply Wall St then extrapolates beyond that. In this case, ten year projections run through to 2035, with 2035 Free Cash Flow estimated at $690.62 million, based on a mix of analyst inputs and gradual growth assumptions.
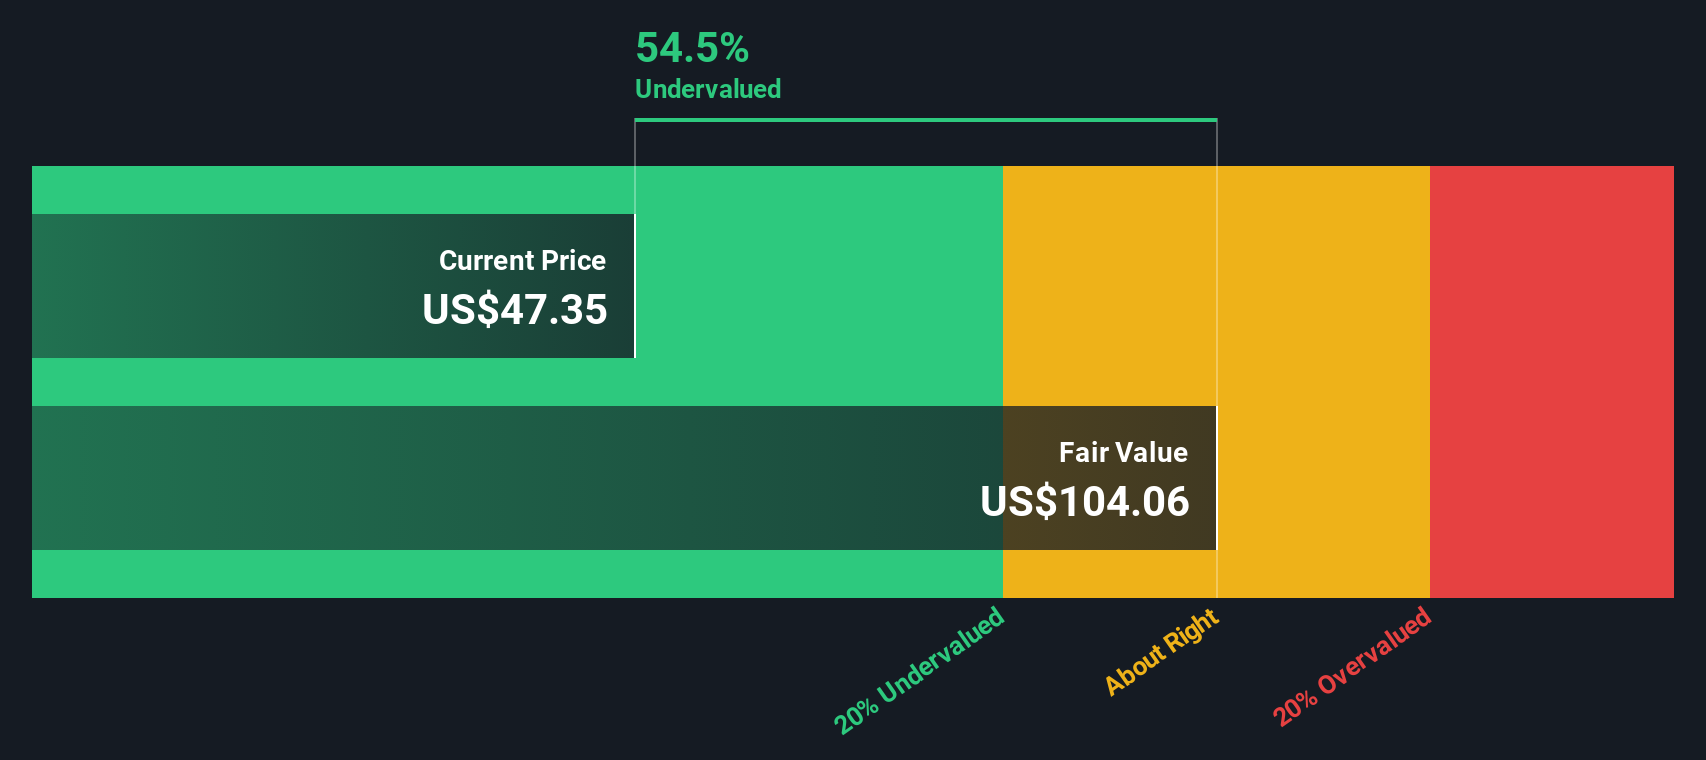
When all of those projected cash flows are discounted back to today, the DCF model produces an estimated intrinsic value of about $100.31 per share. Compared with the recent share price of US$46.39, the model implies a 53.8% discount, which suggests that Sonoco Products is trading well below this cash flow based estimate of value.
Result: UNDERVALUED
Our Discounted Cash Flow (DCF) analysis suggests Sonoco Products is undervalued by 53.8%. Track this in your watchlist or portfolio, or discover 876 more undervalued stocks based on cash flows.
Approach 2: Sonoco Products Price vs Earnings
For profitable companies, the P/E ratio is a useful quick check because it relates what you pay per share to the earnings that business is currently generating. It helps you see how much the market is willing to pay for each dollar of profit.
What counts as a normal or fair P/E depends a lot on growth expectations and risk. Higher expected earnings growth or lower perceived risk can support a higher P/E, while slower growth or higher risk usually point to a lower, more conservative multiple.
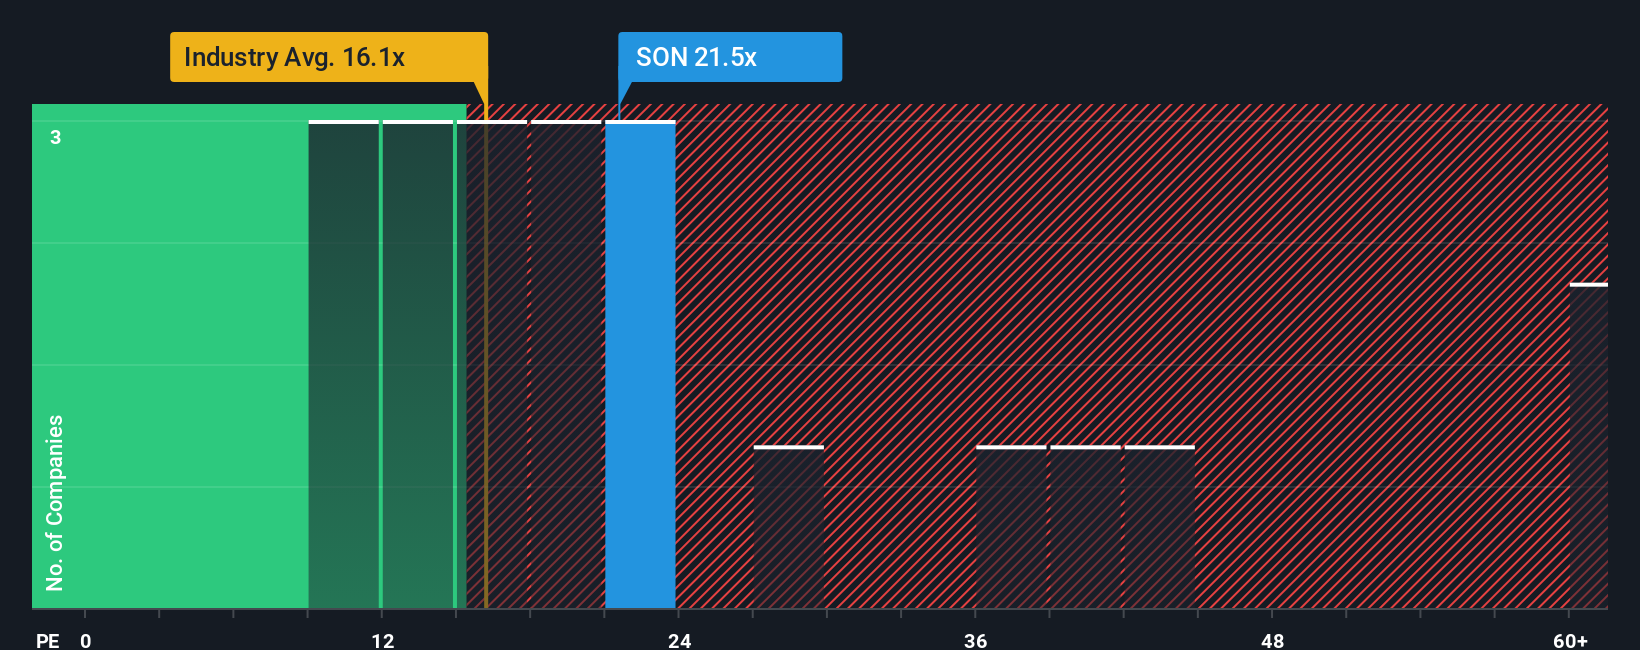
Sonoco Products currently trades on a P/E of 24.73x. That sits above both the Packaging industry average of 15.61x and the peer group average of 16.49x, which on a simple comparison suggests investors are paying a higher price per dollar of earnings than for many peers.
Simply Wall St also provides a Fair Ratio of 19.49x, which is its proprietary view of what the P/E might be given Sonoco Products earnings growth profile, industry, profit margin, market cap and specific risks. This can be more tailored than a straight comparison with peers or industry averages because it adjusts for company level characteristics instead of assuming all businesses deserve the same multiple.
Comparing the current P/E of 24.73x with the Fair Ratio of 19.49x suggests the shares are priced above this model based estimate of a more typical earnings multiple.
Result: OVERVALUED
P/E ratios tell one story, but what if the real opportunity lies elsewhere? Discover 1447 companies where insiders are betting big on explosive growth.
Upgrade Your Decision Making: Choose your Sonoco Products Narrative
Earlier we mentioned that there is an even better way to understand valuation. On Simply Wall St's Community page you can use Narratives, where you write the story you see for Sonoco Products, link that story to your own assumptions for future revenue, earnings and margins, then get a fair value that you can compare with the current price. Because Narratives update automatically when new news, guidance or earnings arrive, you can see, for example, how one investor might build a more optimistic Sonoco Products view around a US$65.00 fair value while another takes a more cautious stance closer to US$50.00, all inside a simple tool used by millions of investors.
Do you think there's more to the story for Sonoco Products? Head over to our Community to see what others are saying!
This article by Simply Wall St is general in nature. We provide commentary based on historical data and analyst forecasts only using an unbiased methodology and our articles are not intended to be financial advice. It does not constitute a recommendation to buy or sell any stock, and does not take account of your objectives, or your financial situation. We aim to bring you long-term focused analysis driven by fundamental data. Note that our analysis may not factor in the latest price-sensitive company announcements or qualitative material. Simply Wall St has no position in any stocks mentioned.
Have feedback on this article? Concerned about the content? Get in touch with us directly. Alternatively, email editorial-team@simplywallst.com