
- PREMIUM
- LIVE QUOTES
- INSTITUTIONS
 Index Options
 State Street
 CME Group
 Nasdaq
 Cboe
Cboe TradingView
 Wall Street Journal
Is BYD (SEHK:1211) Priced Right After Mixed Returns And EV Competition Headlines
- Wondering if BYD's share price still lines up with its underlying worth, or if market sentiment has moved ahead of the fundamentals.
- BYD last closed at HK$95.30, with returns of a 0.1% decline over 7 days, a 4.0% decline over 30 days, a 3.5% decline year to date, but a 13.6% gain over 1 year, 35.9% over 3 years and 14.4% over 5 years, which hints at shifting risk and return perceptions over different timeframes.
- Recent coverage around BYD has focused on its role in the electric vehicle and battery space and how investor expectations are adjusting as competition and policy headlines continue to evolve. These developments give context to the mixed share price performance across shorter and longer periods.
- Our valuation checks currently give BYD a score of 1 out of 6. Next, we will look at what traditional valuation methods say about that number, and then finish with a broader way of thinking about what the market might be pricing in.
BYD scores just 1/6 on our valuation checks. See what other red flags we found in the full valuation breakdown.
Approach 1: BYD Discounted Cash Flow (DCF) Analysis
A Discounted Cash Flow model takes estimates of the cash a business could generate in the future, then discounts those cash flows back to today to get an implied value for the equity.
For BYD, the model used is a 2 Stage Free Cash Flow to Equity approach, based on cash flows reported in CN¥. The latest twelve month free cash flow is a loss of CN¥29,051.48m. Analysts and extrapolations then feed into a ten year path, with forecast free cash flow in 2027 of CN¥72,397.29m and discounted projections ranging from CN¥59,700.85m in 2026 to CN¥35,872.90m in 2035.
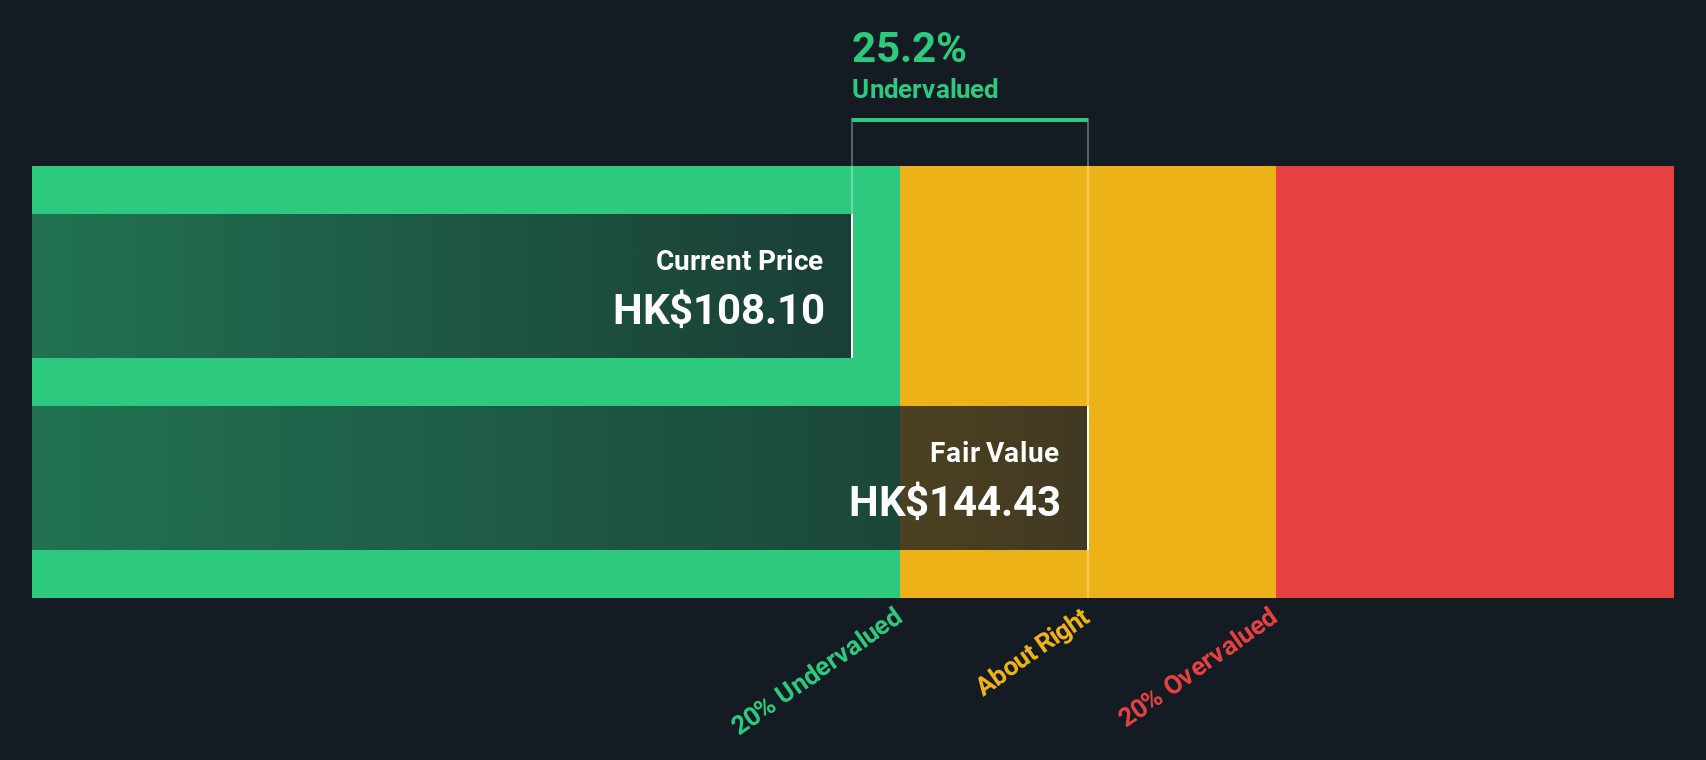
When these projected cash flows are discounted and aggregated, the DCF points to an estimated intrinsic value of HK$115.26 per share. Compared to the recent share price of HK$95.30, that implies the shares trade at a 17.3% discount to this cash flow based estimate. Under this model, the market price is below the modelled value.
Result: UNDERVALUED
Our Discounted Cash Flow (DCF) analysis suggests BYD is undervalued by 17.3%. Track this in your watchlist or portfolio, or discover 876 more undervalued stocks based on cash flows.
Approach 2: BYD Price vs Earnings
For profitable companies, the P/E ratio is a useful shorthand for how much investors are paying for each unit of earnings, which can help you compare pricing across businesses that already generate profits.
What counts as a "normal" P/E often reflects two things: how fast earnings are expected to grow and how risky those earnings are perceived to be. Higher expected growth or lower perceived risk can support a higher P/E, while slower growth or higher risk tends to line up with a lower P/E.
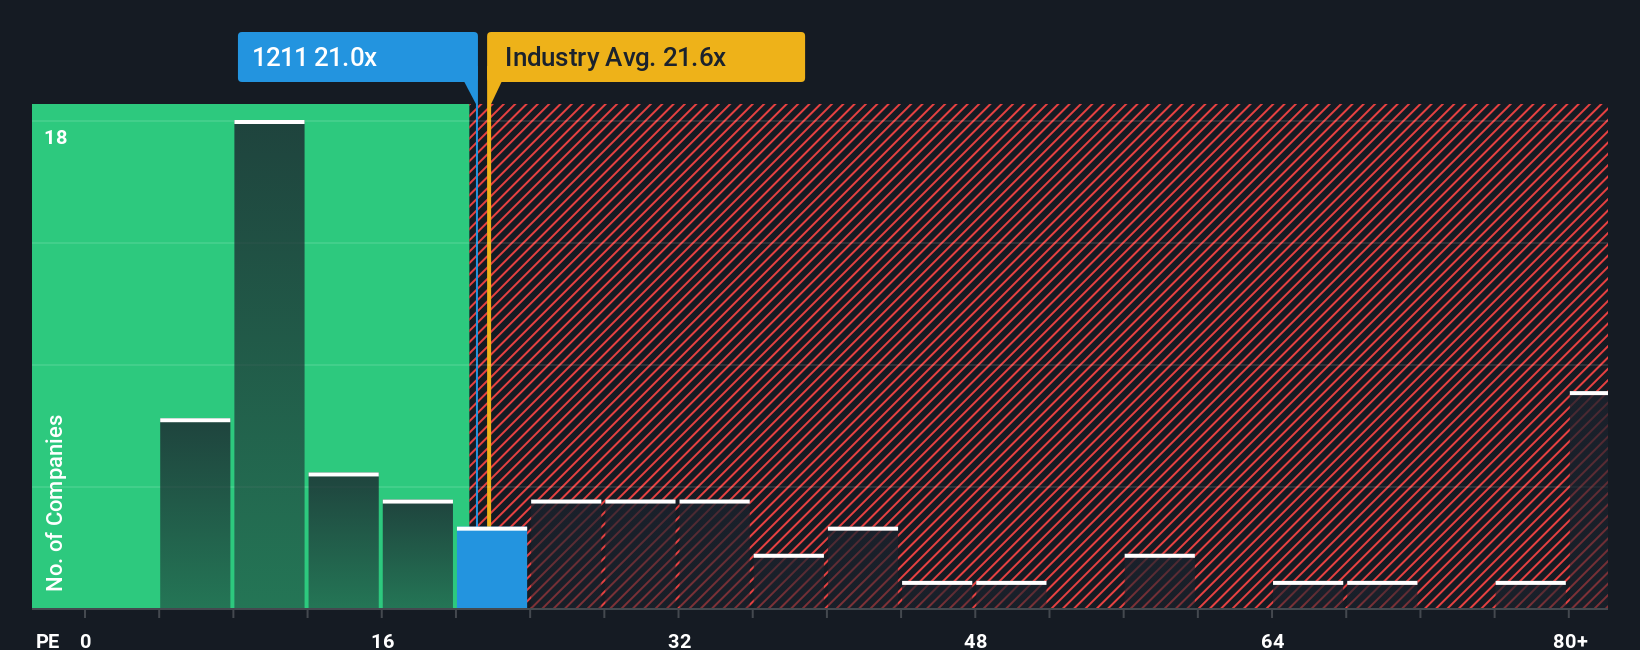
BYD currently trades on a P/E of 20.32x. That sits above the Auto industry average of 18.59x and above the peer group average of 8.80x, so on simple comparisons the shares look more expensive than many listed peers.
Simply Wall St’s Fair Ratio for BYD is 14.00x. This is a proprietary estimate of what a reasonable P/E could be for the company, given factors such as its earnings growth profile, industry, profit margins, market value and risk characteristics. Because it blends these company specific features, it can be more informative than headline peer or industry averages alone.
Since BYD’s current P/E of 20.32x is above the Fair Ratio of 14.00x, this framework points to the shares trading above that indicative fair level.
Result: OVERVALUED
P/E ratios tell one story, but what if the real opportunity lies elsewhere? Discover 1447 companies where insiders are betting big on explosive growth.
Upgrade Your Decision Making: Choose your BYD Narrative
Earlier we mentioned that there is an even better way to understand valuation, so let us introduce you to Narratives, which are simply your own story about BYD, backed up by your view on its fair value and your expectations for future revenue, earnings and profit margins.
A Narrative links what you believe about the business to a financial forecast, and then to a fair value that you can compare to the current share price to help you decide whether the stock looks attractive or not.
On Simply Wall St, Narratives are available on the Community page and used by millions of investors, and the platform keeps them updated when new information such as news or earnings is added, so your story and numbers stay in sync.
For example, one BYD Narrative might assume very strong long term revenue growth and high margins that lead to a higher fair value than today’s price, while another might use more conservative growth and margins that result in a fair value below the current price.
Do you think there's more to the story for BYD? Head over to our Community to see what others are saying!

This article by Simply Wall St is general in nature. We provide commentary based on historical data and analyst forecasts only using an unbiased methodology and our articles are not intended to be financial advice. It does not constitute a recommendation to buy or sell any stock, and does not take account of your objectives, or your financial situation. We aim to bring you long-term focused analysis driven by fundamental data. Note that our analysis may not factor in the latest price-sensitive company announcements or qualitative material. Simply Wall St has no position in any stocks mentioned.
Have feedback on this article? Concerned about the content? Get in touch with us directly. Alternatively, email editorial-team@simplywallst.com