
- PREMIUM
- LIVE QUOTES
- INSTITUTIONS
 Index Options
 State Street
 CME Group
 Nasdaq
 Cboe
Cboe TradingView
 Wall Street Journal
Is It Time To Reconsider Amazon.com (AMZN) After Its Recent 5 Year Share Price Performance
- If you have ever wondered whether Amazon.com shares are still offering value after a long run as a market favorite, this breakdown is designed to help you put the current price into context.
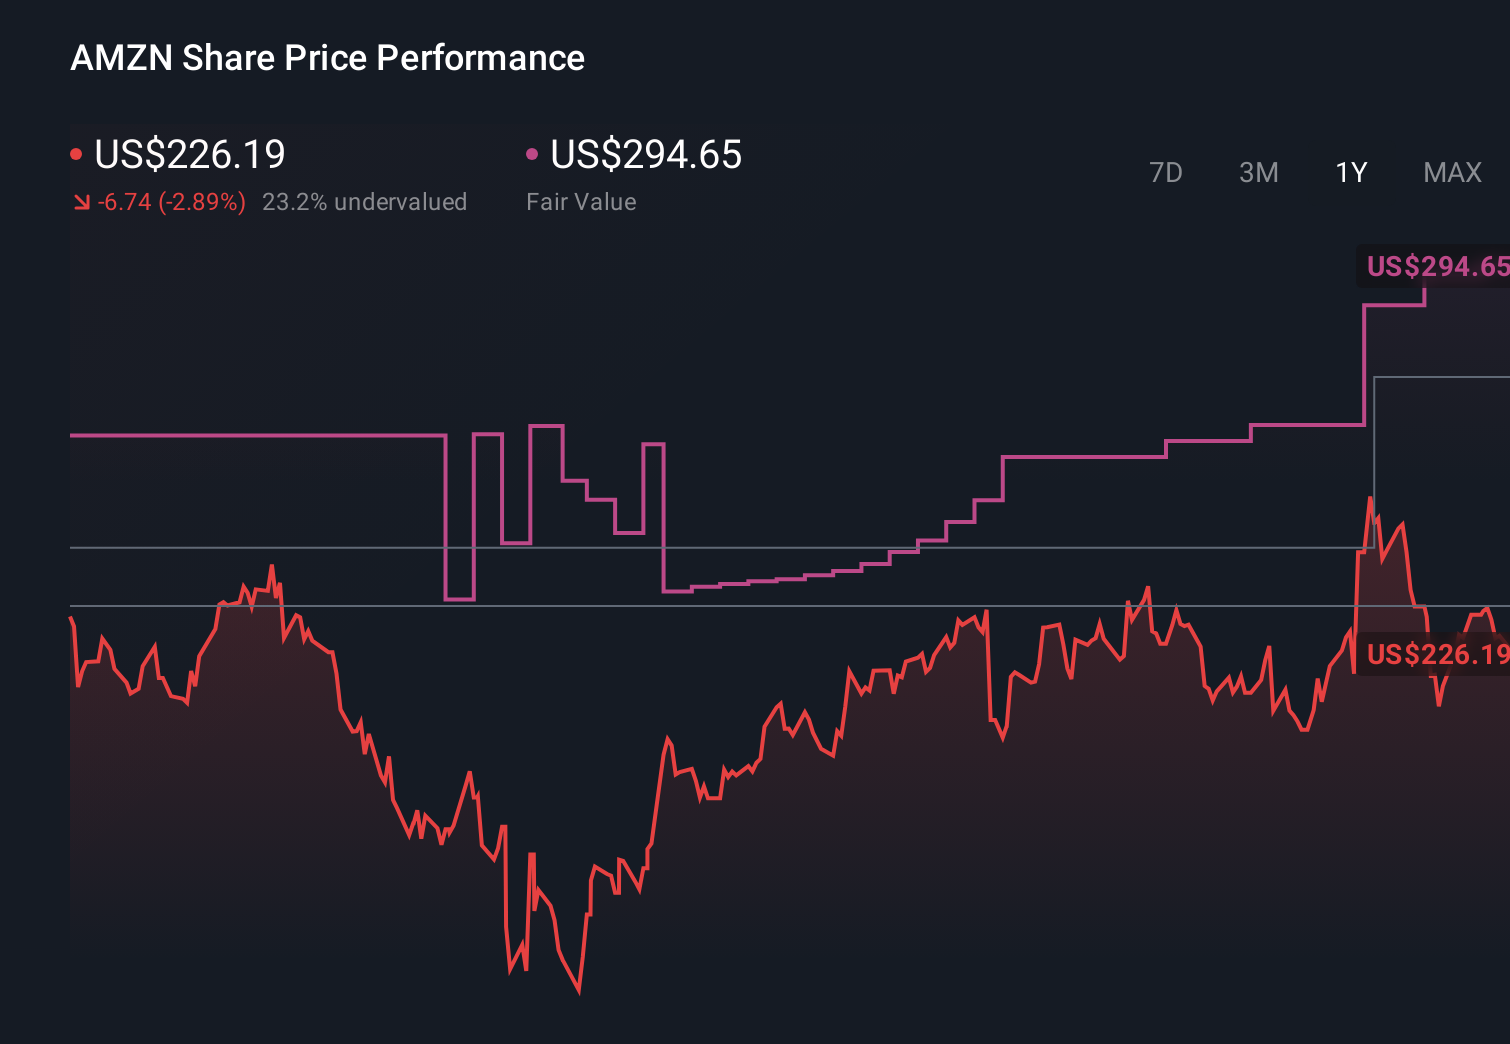
- At a last close of US$240.93, the stock has returns of 4.4% over 7 days, 6.2% over 30 days, 6.4% year to date, 8.5% over 1 year and 52.2% over 5 years, which gives useful reference points as you think about risk and reward today.
- Recent headlines around Amazon.com have continued to focus on its scale in e commerce and cloud services, as well as its ongoing investments across logistics, advertising and new technologies. This steady flow of business updates helps frame how investors are thinking about the company’s long term position and what they are willing to pay for the stock now.
- According to Simply Wall St, Amazon.com currently scores 5 out of 6 on its valuation checks, which suggests the shares screen as undervalued on most of the methods used. We will walk through those approaches next and also point you to an even more complete way to think about value at the end of the article.
Find out why Amazon.com's 8.5% return over the last year is lagging behind its peers.
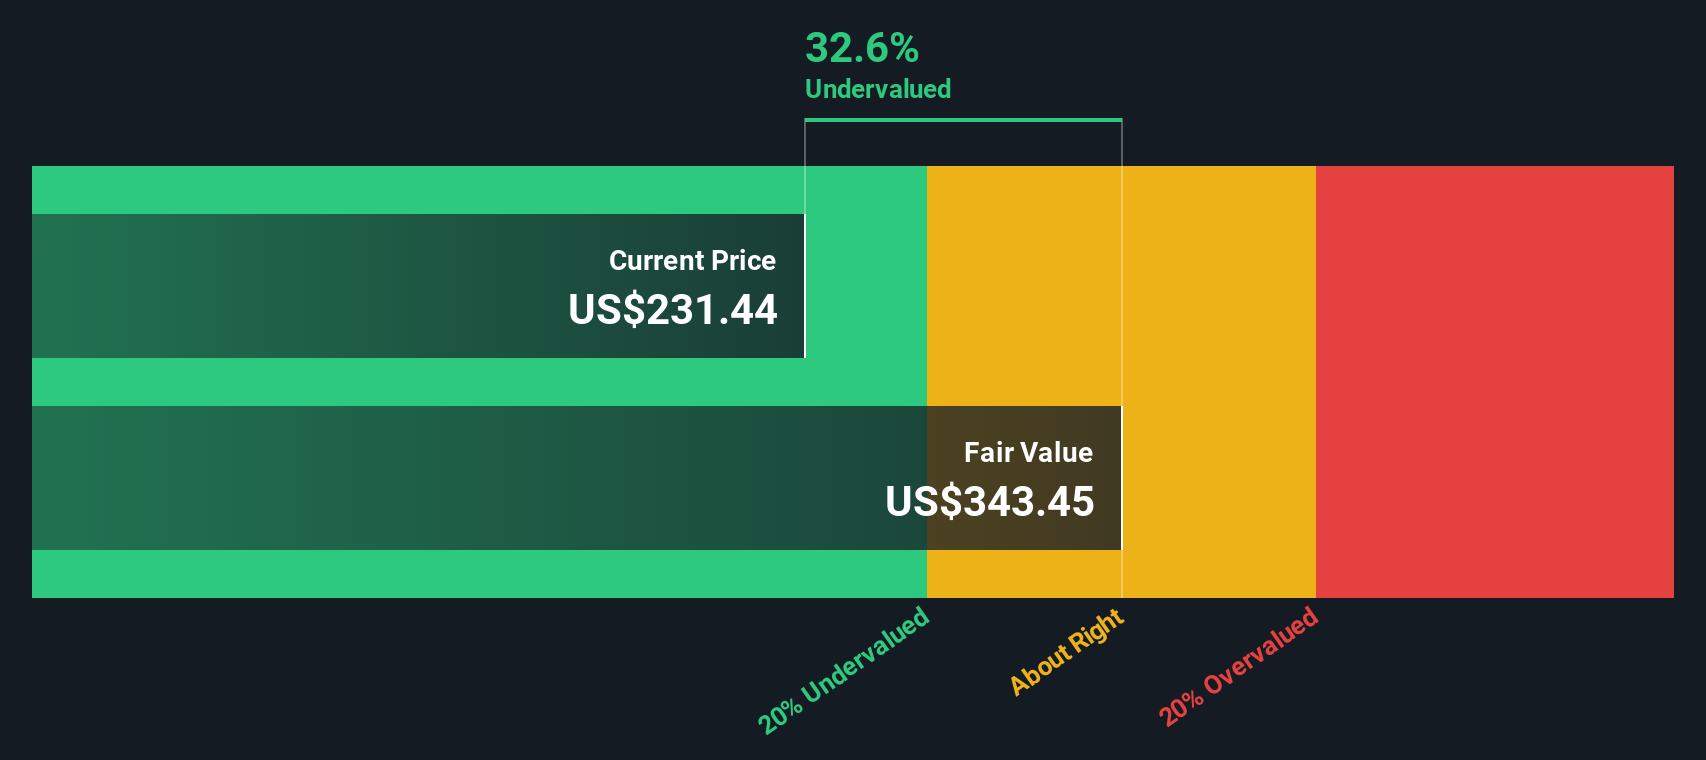
Approach 1: Amazon.com Discounted Cash Flow (DCF) Analysis
A Discounted Cash Flow, or DCF, model takes estimates of a company’s future cash flows and discounts them back to today’s dollars using a required rate of return. The idea is to work out what those future cash flows are worth right now, then compare that value to the current share price.
For Amazon.com, Simply Wall St uses a 2 Stage Free Cash Flow to Equity model. The latest twelve month free cash flow is about $40.0b. Using analyst forecasts and then extending those estimates, free cash flow is projected to reach about $190.1b by 2030, with a series of annual projections between 2026 and 2035 that are progressively discounted back to today’s value.
Adding up those discounted cash flows produces an estimated intrinsic value of about $373.41 per share. Against the recent share price of $240.93, this implies the stock trades at roughly a 35.5% discount to that DCF estimate. On this model, the shares screen as undervalued today.
Result: UNDERVALUED
Our Discounted Cash Flow (DCF) analysis suggests Amazon.com is undervalued by 35.5%. Track this in your watchlist or portfolio, or discover 876 more undervalued stocks based on cash flows.
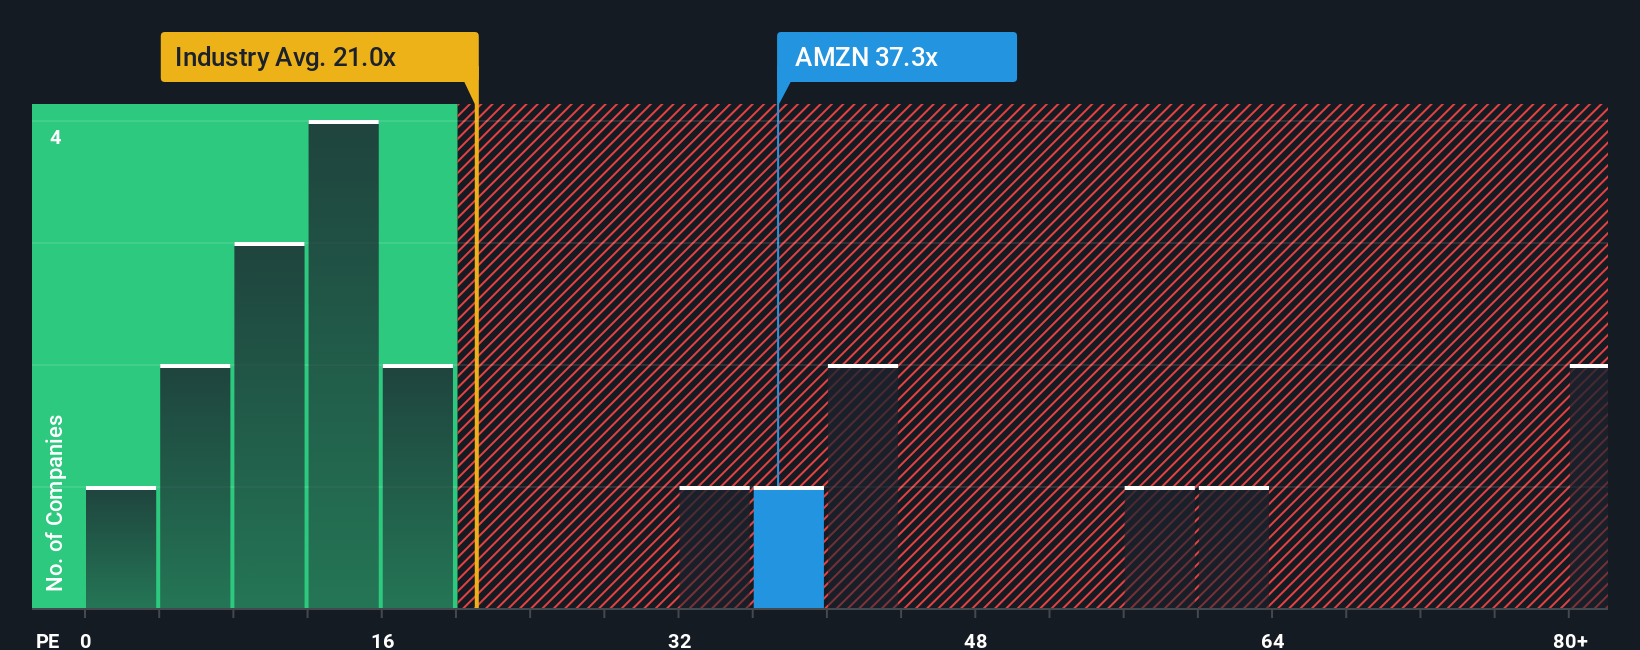
Approach 2: Amazon.com Price vs Earnings
For profitable companies, the P/E ratio is a useful way to think about value because it links what you pay for each share directly to the earnings that business is currently producing. What investors see as a fair P/E usually reflects how they weigh two things, the growth they expect in those earnings and the risk they see around them.
Amazon.com currently trades on a P/E of 33.68x, compared with the Multiline Retail industry average of 19.42x and a peer average of 35.92x. Simply Wall St also calculates a proprietary Fair Ratio of 40.74x, which is the P/E level that might be expected given factors such as Amazon.com’s earnings growth profile, profit margins, industry, market value and risk characteristics.
That Fair Ratio is more tailored than a simple peer or industry comparison because it adjusts for company specific features rather than assuming all businesses in a sector deserve similar P/E levels. With the current P/E of 33.68x sitting below the Fair Ratio of 40.74x, this approach points to the shares trading on a lower multiple than that model suggests could be justified.
Result: UNDERVALUED
P/E ratios tell one story, but what if the real opportunity lies elsewhere? Discover 1447 companies where insiders are betting big on explosive growth.
Upgrade Your Decision Making: Choose your Amazon.com Narrative
Earlier we mentioned that there is an even better way to understand valuation, so let us introduce you to Narratives. Narratives allow you to attach a clear story about Amazon.com to your own numbers for future revenue, earnings, margins and fair value. You can link that story directly to a forecast and a fair value estimate, and then compare that fair value with the current price on Simply Wall St’s Community page, where millions of investors share Narratives that automatically refresh when new news or earnings arrive. For example, you might see one Amazon.com Narrative arguing for a fair value of around US$450 per share based on heavy AI and cloud investment, and another closer to about US$217 to US$227 per share based on more moderate assumptions. This gives you a simple way to see how different views on the same company translate into different decision points.
For Amazon.com however we will make it really easy for you with previews of two leading Amazon.com Narratives:
Fair value: US$450.00 per share
Implied undervaluation vs last close of US$240.93: ((450.00 - 240.93) / 450.00) = 46.5%
Revenue growth assumption: 8.95%
- Argues that Amazon is intentionally keeping margins lower while it spends heavily on AI infrastructure, advertising and automated commerce, with the view that these areas build long term earnings power.
- Highlights AWS, AI related services and advertising as key profit engines, with retail framed as becoming more efficient through automation and data driven operations.
- Suggests the market price does not fully reflect the earnings Amazon could generate once this investment phase matures, which underpins the US$450 fair value estimate.
Fair value: US$234.75 per share
Implied overvaluation vs last close of US$240.93: ((240.93 - 234.75) / 234.75) = 2.6%
Revenue growth assumption: 13.6%
- Starts from a generally positive view of Amazon’s business mix, including e commerce, AWS, advertising and ongoing spending on AI and data centers, but still arrives at a fair value close to the current price.
- Flags points of caution such as AWS growth rates, competition in cloud, supply constraints around power and chips, and tariff uncertainty as reasons to be measured on valuation.
- Sets a fair value of US$234.75, with longer term price projections that depend on growth holding up, and uses these to suggest a disciplined price range an investor might focus on when thinking about Amazon shares.
Taken together, these two Narratives give you a clear range of views around today’s price and help you decide which story for Amazon.com’s future feels closer to your own.
Curious how numbers become stories that shape markets? Explore Community Narratives
Do you think there's more to the story for Amazon.com? Head over to our Community to see what others are saying!
This article by Simply Wall St is general in nature. We provide commentary based on historical data and analyst forecasts only using an unbiased methodology and our articles are not intended to be financial advice. It does not constitute a recommendation to buy or sell any stock, and does not take account of your objectives, or your financial situation. We aim to bring you long-term focused analysis driven by fundamental data. Note that our analysis may not factor in the latest price-sensitive company announcements or qualitative material. Simply Wall St has no position in any stocks mentioned.
Have feedback on this article? Concerned about the content? Get in touch with us directly. Alternatively, email editorial-team@simplywallst.com