
- PREMIUM
- LIVE QUOTES
- INSTITUTIONS
 Index Options
 State Street
 CME Group
 Nasdaq
 Cboe
Cboe TradingView
 Wall Street Journal
Is Shell (LSE:SHEL) Still Attractive After Recent Mixed Share Price Performance
- If you are wondering whether Shell's share price still offers value at current levels, it helps to step back and look at what the recent numbers are really telling you.
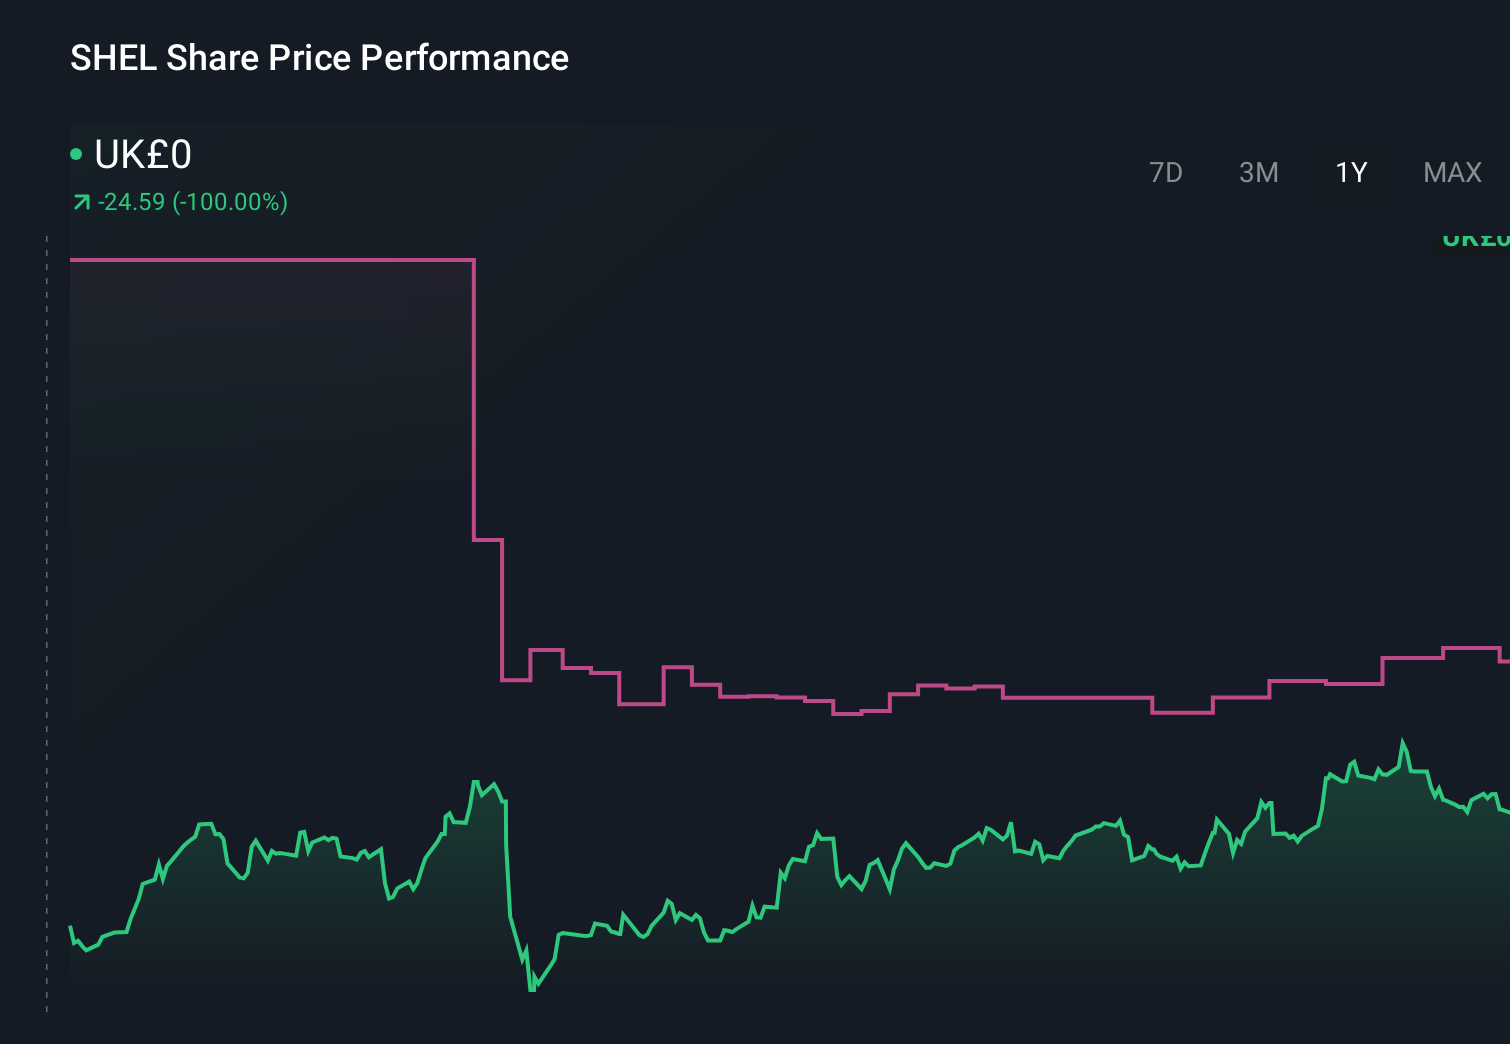
- Shell shares closed at £27.47, with returns of 0.6% over 7 days, a 0.5% decline over 30 days, a 0.5% decline year to date, 9.3% over 1 year, 30.4% over 3 years and 124.2% over 5 years. This gives a mixed picture of shorter term moves versus longer term performance.
- Recently, Shell has been in the headlines as investors weigh its position in global energy markets and its progress on longer term transition plans. These themes often feed directly into how the market prices the stock and help frame whether recent moves look stretched or cautious.
- On Simply Wall St's 6 point valuation checklist, Shell scores 4 out of 6. Next, we will look at how different valuation methods line up with that score and why many investors still find that the best insight comes from combining these models with a broader view at the end of the article.
Approach 1: Shell Discounted Cash Flow (DCF) Analysis
A Discounted Cash Flow, or DCF, model looks at the cash Shell is expected to generate in the future and then discounts those projected cash flows back to today to estimate what the business might be worth per share.
Shell’s latest twelve month Free Cash Flow is reported at US$27.95b. Using a 2 Stage Free Cash Flow to Equity model, analysts and extrapolated estimates project Free Cash Flow through to 2035, with the 2030 figure at US$30.25b and a series of annual projections in between. Earlier years such as 2026 to 2030 draw on analyst inputs, while later years are extrapolated by Simply Wall St based on modest growth assumptions.
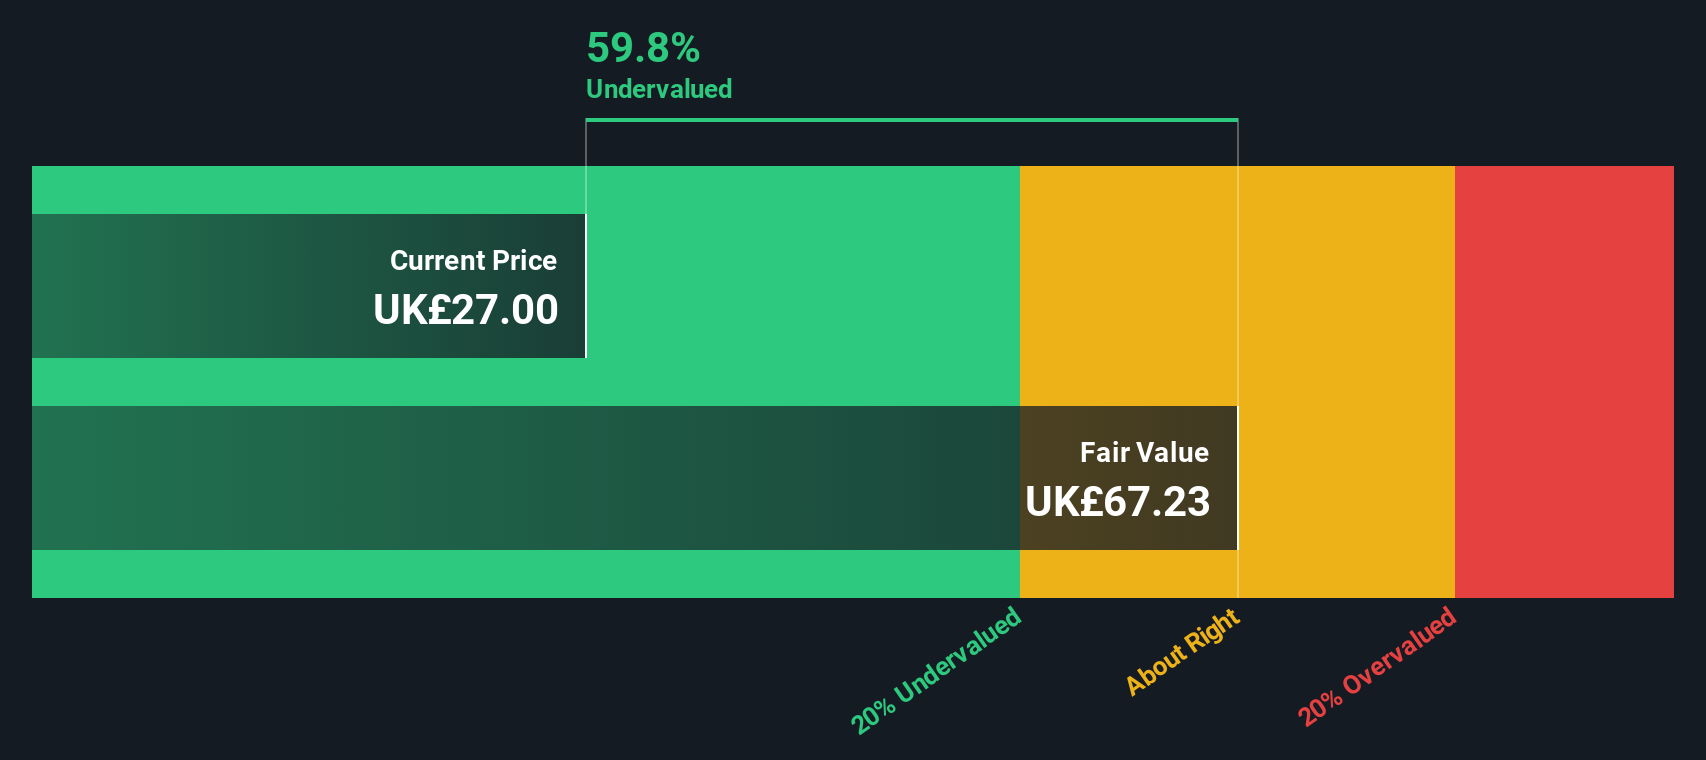
Bringing all of those projected cash flows back to today and allocating them across the share count gives an estimated intrinsic value of £83.26 per share. Compared with the recent share price of £27.47, the model implies Shell trades at a 67.0% discount to this DCF estimate. This suggests the shares may appear significantly undervalued based on this cash flow view alone.
Result: UNDERVALUED
Our Discounted Cash Flow (DCF) analysis suggests Shell is undervalued by 67.0%. Track this in your watchlist or portfolio, or discover 875 more undervalued stocks based on cash flows.
Approach 2: Shell Price vs Earnings
For a profitable company like Shell, the P/E ratio is a useful shorthand for how much investors are paying for each unit of earnings. It ties directly to what the business is currently generating rather than long range forecasts, which many readers find easier to relate to.
What counts as a "normal" P/E often reflects how the market views a company’s growth prospects and risk profile. Higher expected growth or lower perceived risk can support a higher P/E, while slower growth or higher risk tends to be associated with a lower P/E.
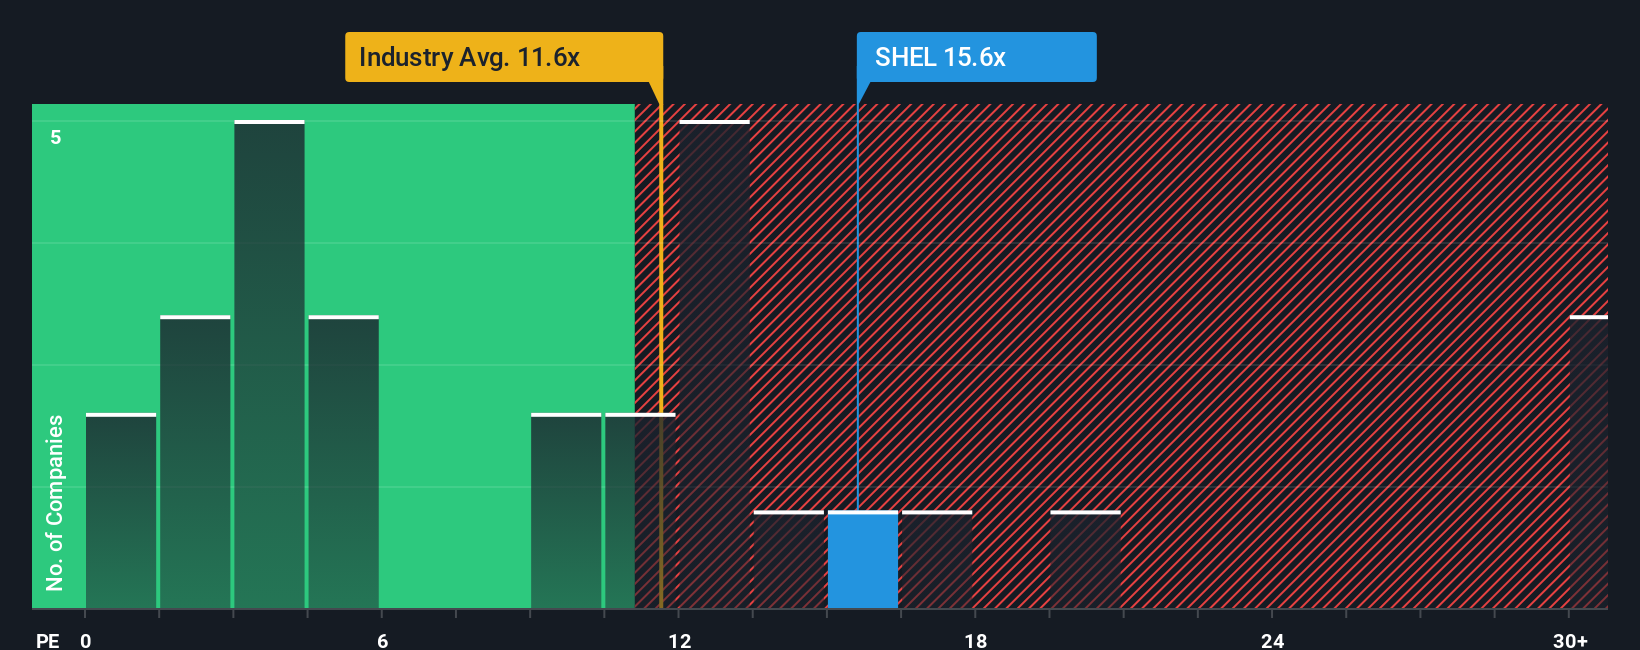
Shell currently trades on a P/E of 14.49x. That sits above the Oil and Gas industry average of 13.48x but below the peer group average of 16.01x. Simply Wall St’s proprietary Fair Ratio for Shell is 17.86x, which is an estimate of the P/E you might expect after factoring in elements such as earnings growth characteristics, industry, profit margins, market cap and company specific risks.
Because the Fair Ratio blends these fundamentals rather than relying only on simple peer or industry comparisons, it can give a more tailored view. With Shell’s actual P/E of 14.49x below the Fair Ratio of 17.86x, the shares appear inexpensive on this earnings based measure.
Result: UNDERVALUED
P/E ratios tell one story, but what if the real opportunity lies elsewhere? Discover 1447 companies where insiders are betting big on explosive growth.
Upgrade Your Decision Making: Choose your Shell Narrative
Earlier we mentioned that there is an even better way to understand valuation. Let us introduce you to Narratives, where you turn your view of Shell into a simple story that links your assumptions about future revenue, earnings and margins to a forecast and then to a fair value. This all happens within an easy tool on Simply Wall St’s Community page that millions of investors use to compare their Fair Value against the current price. They can also see that Narratives update automatically when fresh news or earnings arrive, and understand why one investor might see Shell closer to the higher analyst price target of £39.36 while another focuses on the lower end at £27.06, based on different expectations about LNG growth, chemicals profitability or buyback funding.
Do you think there's more to the story for Shell? Head over to our Community to see what others are saying!
This article by Simply Wall St is general in nature. We provide commentary based on historical data and analyst forecasts only using an unbiased methodology and our articles are not intended to be financial advice. It does not constitute a recommendation to buy or sell any stock, and does not take account of your objectives, or your financial situation. We aim to bring you long-term focused analysis driven by fundamental data. Note that our analysis may not factor in the latest price-sensitive company announcements or qualitative material. Simply Wall St has no position in any stocks mentioned.
Have feedback on this article? Concerned about the content? Get in touch with us directly. Alternatively, email editorial-team@simplywallst.com