
- PREMIUM
- LIVE QUOTES
- INSTITUTIONS
 Index Options
 State Street
 CME Group
 Nasdaq
 Cboe
Cboe TradingView
 Wall Street Journal
Is Marsh & McLennan (MMC) Pricing Reflect Long Term Value After Recent 1 Year Decline
- This article is written to help you assess whether Marsh & McLennan Companies is offering fair value at its recent price, or whether you might be paying too much for a quality insurance and consulting group, by unpacking that question step by step.
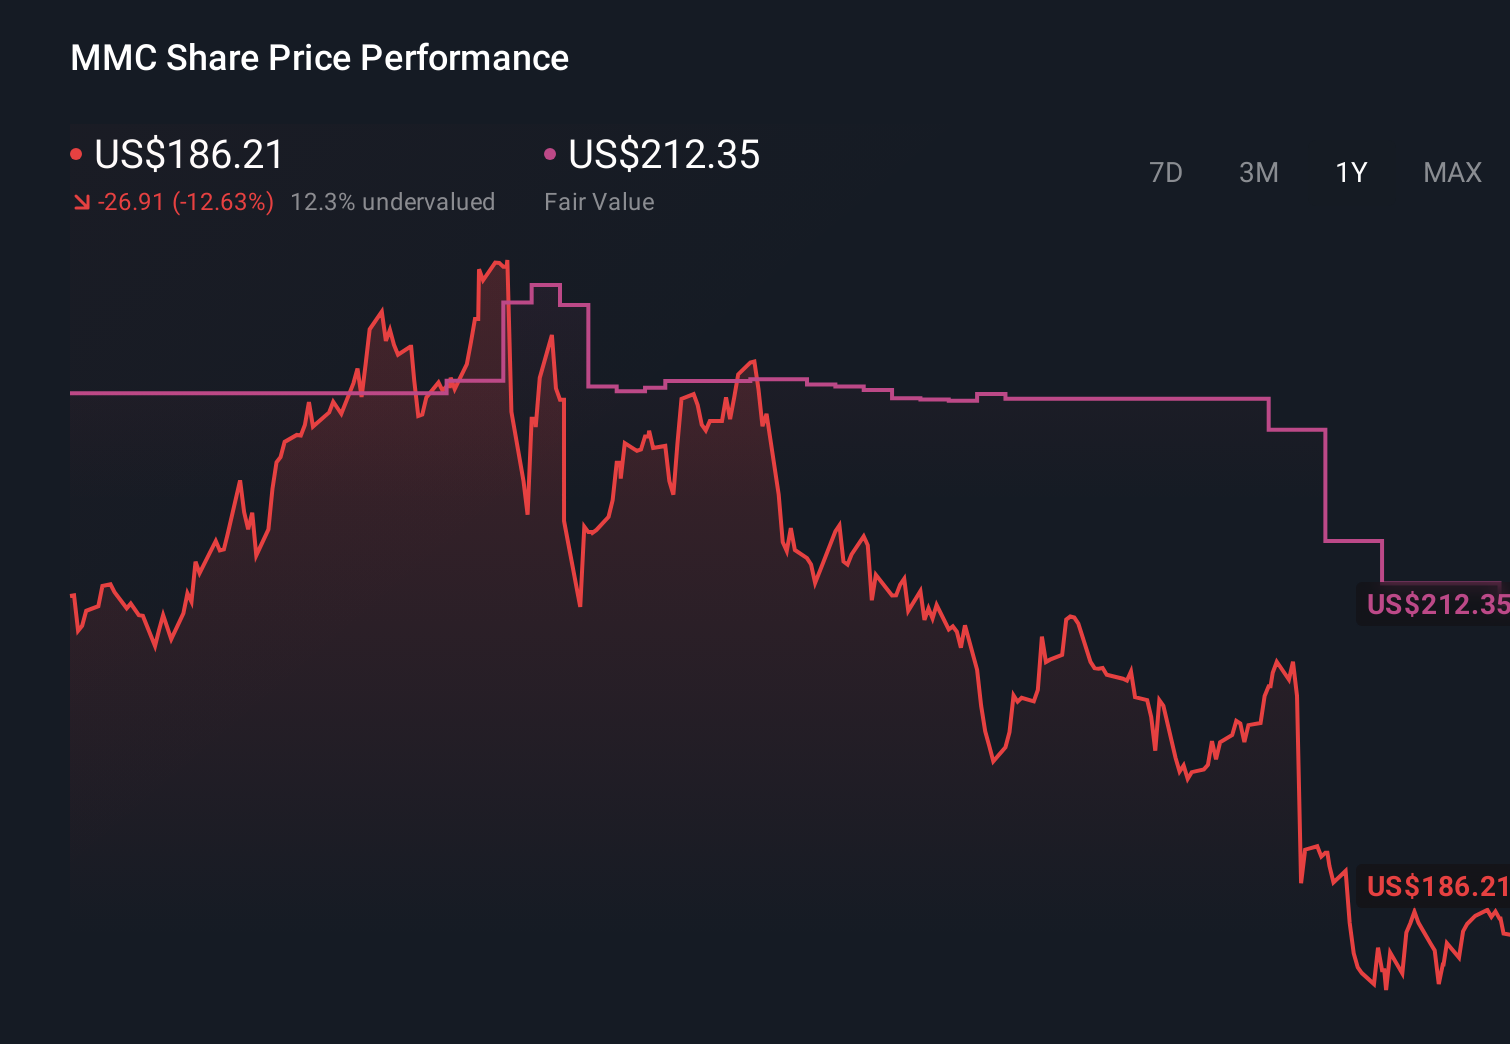
- The stock last closed at US$185.54, with returns of 2.0% over the past 30 days, 1.7% year to date, a 10.2% decline over 1 year, and gains of 13.9% over 3 years and 76.8% over 5 years. Taken together, these figures present a mixed picture of recent price moves and longer term performance.
- Recent coverage around Marsh & McLennan has focused on its position as a large, diversified player in insurance broking and consulting, as investors weigh the value of resilience in this part of the market. This context, combined with the return profile above, has kept attention on whether the current price correctly reflects the company’s fundamentals and risk profile.
- On our framework, Marsh & McLennan scores 3/6 on valuation checks. This means it screens as undervalued on half of the measures we look at. In the next sections we will walk through those methods and then finish with a way of thinking about valuation that can help tie them all together.
Approach 1: Marsh & McLennan Companies Excess Returns Analysis
The Excess Returns model looks at how much value Marsh & McLennan Companies creates above the return that equity investors typically require. It focuses on what the company earns on its equity base compared with its cost of equity.
Here, the starting Book Value is $30.92 per share, with a Stable Book Value estimate of $38.74 per share, based on weighted future book value estimates from 4 analysts. Against that equity base, the model uses a Stable EPS of $11.55 per share, sourced from weighted future return on equity estimates from 6 analysts.
The Cost of Equity is set at $2.69 per share, so the model estimates an Excess Return of $8.86 per share. That is underpinned by an average Return on Equity of 29.83%, which is well above the assumed equity cost in this framework.
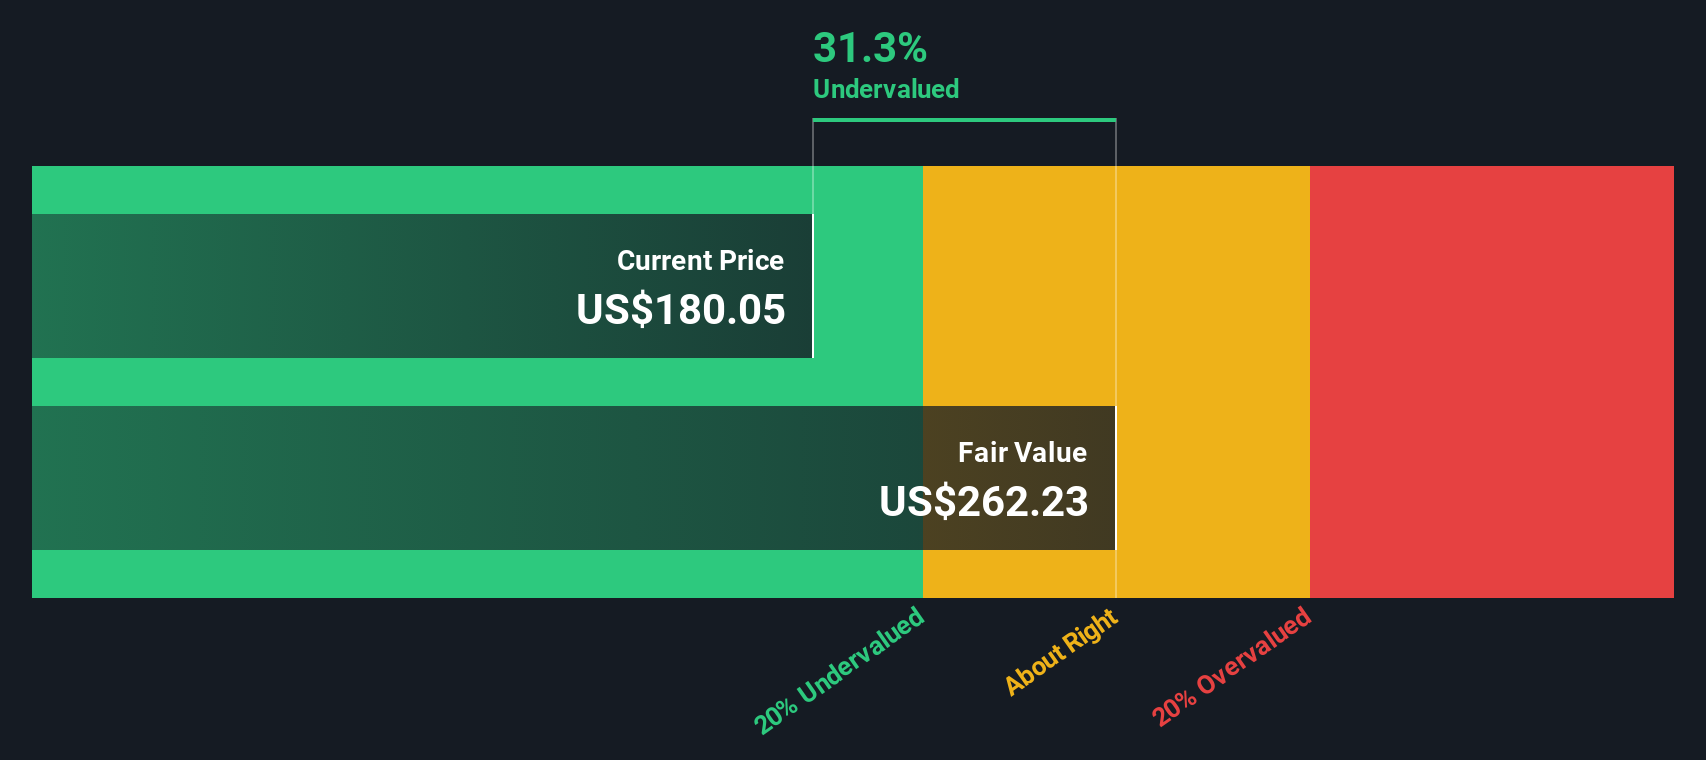
Combining these elements, the Excess Returns model arrives at an intrinsic value of about $278.44 per share, compared with the recent share price of $185.54. This implies Marsh & McLennan Companies is trading at roughly a 33.4% discount to this estimate.
Result: UNDERVALUED
Our Excess Returns analysis suggests Marsh & McLennan Companies is undervalued by 33.4%. Track this in your watchlist or portfolio, or discover 875 more undervalued stocks based on cash flows.
Approach 2: Marsh & McLennan Companies Price vs Earnings
For a profitable company like Marsh & McLennan Companies, the P/E ratio is a useful way to think about what you are paying for each dollar of earnings. It ties directly to how quickly earnings might compound over time and how dependable those earnings appear to be.
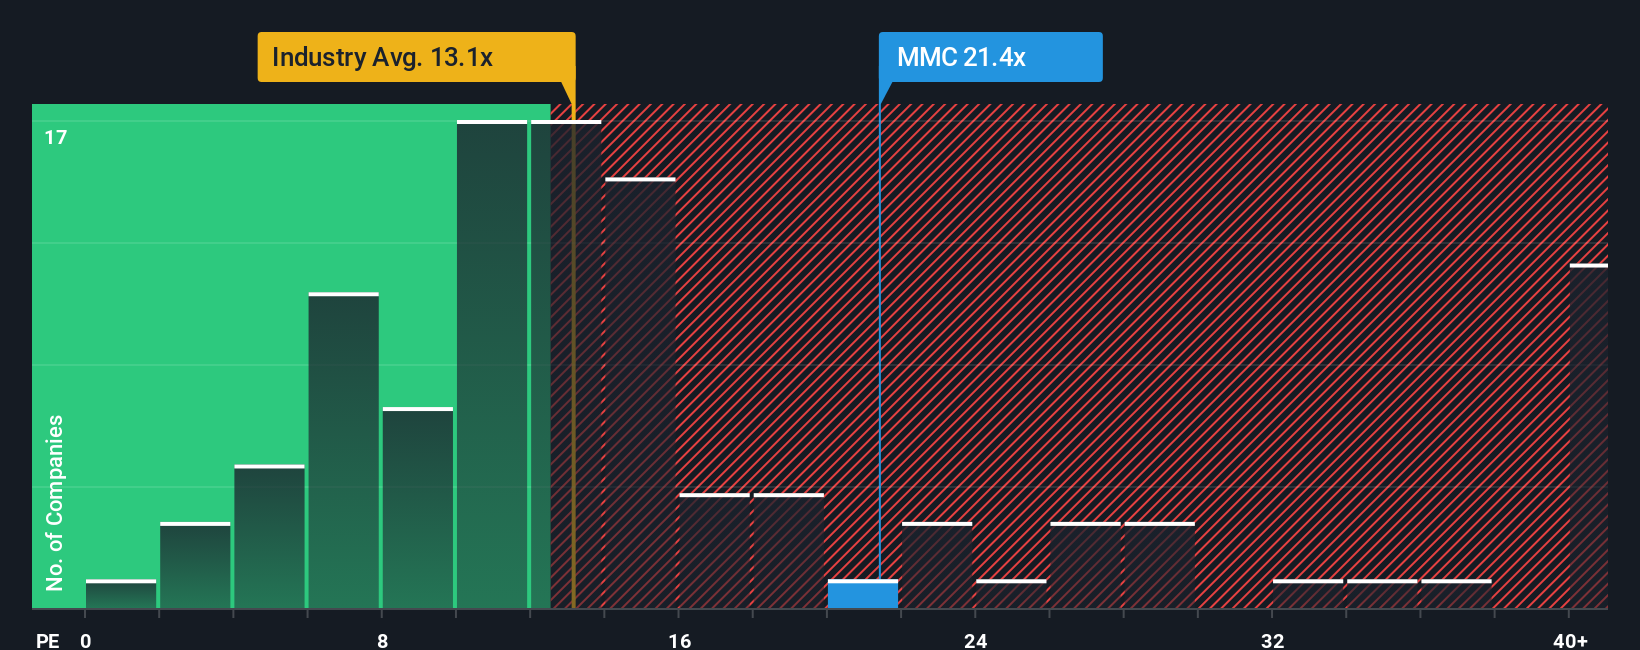
In simple terms, higher growth expectations and lower perceived risk usually justify a higher P/E, while slower growth and higher risk tend to go with a lower multiple. Marsh & McLennan currently trades on a P/E of 22.0x. That sits above the Insurance industry average P/E of about 12.9x but below the peer group average of 28.2x.
Simply Wall St’s Fair Ratio for Marsh & McLennan is 15.36x. This Fair Ratio is a proprietary estimate of what a reasonable P/E could be given the company’s earnings growth profile, industry, profit margins, market cap and risk characteristics. Because it blends these company specific drivers, it can give a more tailored reference point than a simple comparison with broad industry or peer averages.
Comparing the current 22.0x P/E to the 15.36x Fair Ratio suggests the shares are trading above this model based reference level.
Result: OVERVALUED
P/E ratios tell one story, but what if the real opportunity lies elsewhere? Discover 1447 companies where insiders are betting big on explosive growth.
Upgrade Your Decision Making: Choose your Marsh & McLennan Companies Narrative
Earlier we mentioned that there is an even better way to understand valuation, and on Simply Wall St that starts with Narratives. You set out your own story for Marsh & McLennan Companies, plug in your assumptions for future revenue, earnings, margins and fair value, and the platform, used by millions of investors through the Community page, links that story to a forecast and fair value. It then compares this with the current price to help you judge whether to buy or sell, and keeps your view up to date as new news or earnings arrive. One investor might build a Narrative around the higher end fair value of about US$258 per share, while another might anchor to the lower end near US$197, both using the same information but drawing different, clearly expressed conclusions.
Do you think there's more to the story for Marsh & McLennan Companies? Head over to our Community to see what others are saying!
This article by Simply Wall St is general in nature. We provide commentary based on historical data and analyst forecasts only using an unbiased methodology and our articles are not intended to be financial advice. It does not constitute a recommendation to buy or sell any stock, and does not take account of your objectives, or your financial situation. We aim to bring you long-term focused analysis driven by fundamental data. Note that our analysis may not factor in the latest price-sensitive company announcements or qualitative material. Simply Wall St has no position in any stocks mentioned.
Have feedback on this article? Concerned about the content? Get in touch with us directly. Alternatively, email editorial-team@simplywallst.com