
- PREMIUM
- LIVE QUOTES
- INSTITUTIONS
 Index Options
 State Street
 CME Group
 Nasdaq
 Cboe
Cboe TradingView
 Wall Street Journal
Is Hologic (HOLX) Pricing Look Interesting After Recent Flat Share Performance
- If you are wondering whether Hologic at around US$74.91 is fairly priced or offering value, you are not alone. This article walks through what the current market price might be implying.
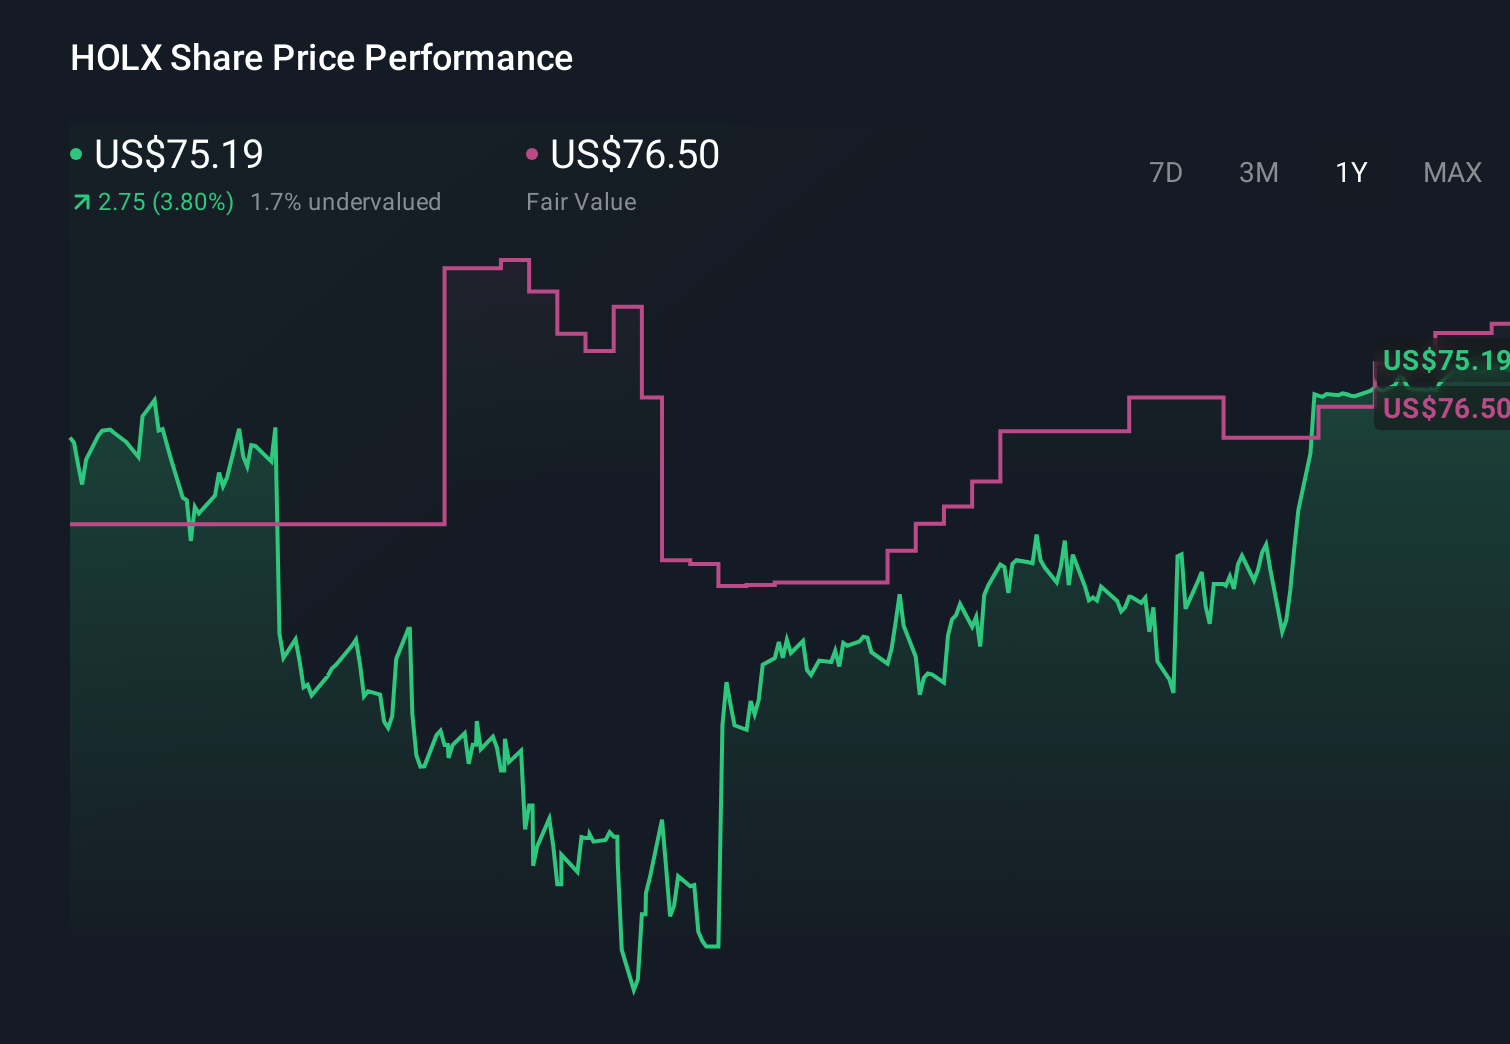
- The share price has been relatively steady, with a 0.5% return over the last week, a roughly flat 30 day move at a 0.1% decline, a 0.5% return year to date, 3.1% over 1 year, and declines of 7.0% and 3.5% across the last 3 and 5 years.
- Recent coverage of Hologic has focused on its position in medical devices and diagnostics, as investors weigh how this mix of businesses fits into their portfolios over the longer term. This context helps frame why the stock has seen modest moves rather than sharp swings in recent periods.
- On our valuation checks, Hologic scores 4 out of 6. You can see the breakdown in this valuation score of 4. Next, we will walk through what different valuation approaches say about the stock and then finish with a way of looking at valuation that ties the numbers back to the bigger picture for the business.
Approach 1: Hologic Discounted Cash Flow (DCF) Analysis
A Discounted Cash Flow, or DCF, model takes projected future cash flows and discounts them back to today using a required return, then adds them up to estimate what the business might be worth at present.
For Hologic, the model uses a 2 Stage Free Cash Flow to Equity approach based on cash flow projections. The latest twelve-month Free Cash Flow is about $905.8 million. Analyst inputs extend through 2028, with Simply Wall St extrapolating further to 2035. For example, projected Free Cash Flow is $1,052 million in 2026 and $1,512.7 million in 2035, all in dollar terms.
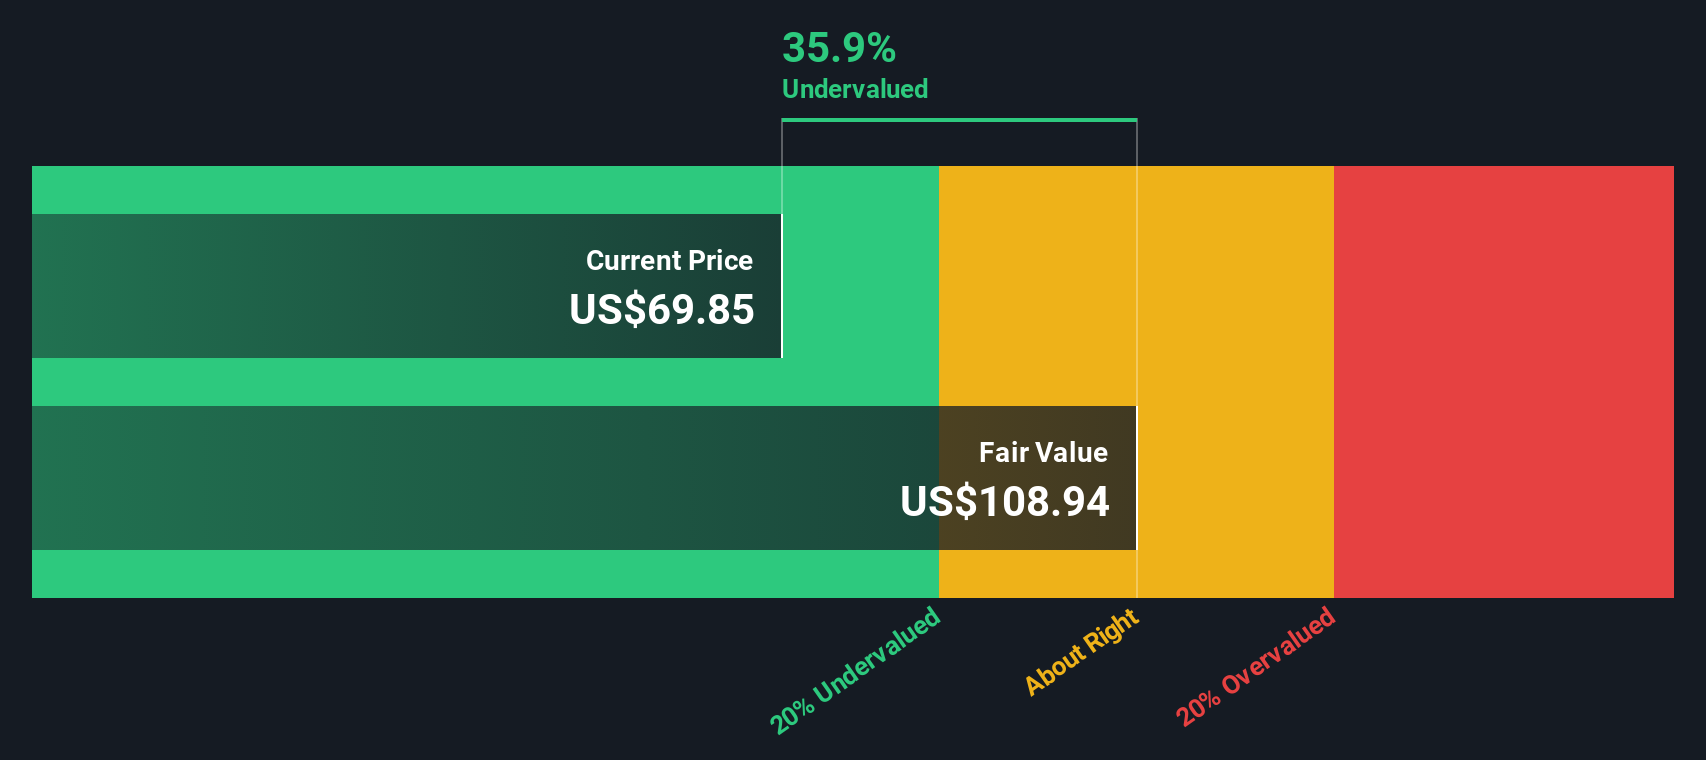
When these projected cash flows are discounted back and combined, the model arrives at an estimated intrinsic value of about $105.71 per share. Compared with the recent share price of around $74.91, the DCF output implies Hologic is trading at roughly a 29.1% discount. On this measure, the shares appear to be undervalued.
Result: UNDERVALUED
Our Discounted Cash Flow (DCF) analysis suggests Hologic is undervalued by 29.1%. Track this in your watchlist or portfolio, or discover 875 more undervalued stocks based on cash flows.
Approach 2: Hologic Price vs Earnings
For profitable companies, the P/E ratio is a useful way to relate what you are paying per share to the earnings the business is currently generating. It gives you a quick sense of how many dollars investors are willing to pay today for one dollar of annual earnings.
What counts as a “normal” or “fair” P/E depends on how the market views a company’s growth potential and risk profile. Higher expected growth or lower perceived risk can support a higher P/E, while lower growth expectations or higher risk typically align with a lower P/E.
Hologic currently trades on a P/E of about 29.5x, compared with the Medical Equipment industry average of roughly 30.7x and a peer group average around 55.0x. Simply Wall St also calculates a proprietary “Fair Ratio” of 29.0x for Hologic. This Fair Ratio aims to reflect what P/E might make sense after considering factors such as earnings growth, industry, profit margins, market cap and company specific risks.
Because the Fair Ratio blends these company specific drivers, it can be more tailored than a simple comparison with peers or the broad industry that may differ in size, growth or risk.
With Hologic’s actual P/E of 29.5x sitting very close to the Fair Ratio of 29.0x, the shares appear roughly aligned with these fundamentals.
Result: ABOUT RIGHT

P/E ratios tell one story, but what if the real opportunity lies elsewhere? Discover 1447 companies where insiders are betting big on explosive growth.
Upgrade Your Decision Making: Choose your Hologic Narrative
Earlier we mentioned that there is an even better way to understand valuation, so let us introduce Narratives, a simple tool on Simply Wall St’s Community page where you connect your view of Hologic’s story with your own forecast for revenue, earnings and margins. You can then translate that into a Fair Value, and compare it to the current price to decide whether the stock looks attractive or expensive. The Narrative updates automatically when new news or earnings land. For example, one investor might plug in assumptions closer to the higher US$94 price target, while another leans toward the lower US$65 view. Both can clearly see how their different expectations lead to different Fair Values and, ultimately, different decisions about when they might buy or sell.
Do you think there's more to the story for Hologic? Head over to our Community to see what others are saying!
This article by Simply Wall St is general in nature. We provide commentary based on historical data and analyst forecasts only using an unbiased methodology and our articles are not intended to be financial advice. It does not constitute a recommendation to buy or sell any stock, and does not take account of your objectives, or your financial situation. We aim to bring you long-term focused analysis driven by fundamental data. Note that our analysis may not factor in the latest price-sensitive company announcements or qualitative material. Simply Wall St has no position in any stocks mentioned.
Have feedback on this article? Concerned about the content? Get in touch with us directly. Alternatively, email editorial-team@simplywallst.com