
- PREMIUM
- LIVE QUOTES
- INSTITUTIONS
 Index Options
 State Street
 CME Group
 Nasdaq
 Cboe
Cboe TradingView
 Wall Street Journal
Assessing O'Reilly Automotive (ORLY) Valuation After Recent Share Price Weakness
Recent share price weakness in O'Reilly Automotive (ORLY), with negative returns over the past month and past 3 months, has put the auto parts retailer back on many investors’ watchlists for a closer fundamental check.
See our latest analysis for O'Reilly Automotive.
While the recent 30 day and 90 day share price returns of 8.6% and 10.3% declines signal fading short term momentum, O'Reilly Automotive still shows a 13% 1 year total shareholder return and a 173.7% 5 year total shareholder return.
If recent weakness in O'Reilly Automotive has you reassessing the auto space, it could be a useful time to scan other auto manufacturers that might fit your watchlist next.
So with earnings and revenue still growing annually, a 21.5% discount to the average analyst price target, and a low internal value score of 2, is O'Reilly now offering upside, or is the market already pricing in future growth?
Most Popular Narrative: 18% Undervalued
With O'Reilly Automotive last closing at $90.39 against a most followed fair value estimate of $110.20, the narrative sees meaningful upside embedded in its long term forecasts.
The analysts have a consensus price target of $106.955 for O'Reilly Automotive based on their expectations of its future earnings growth, profit margins and other risk factors. However, there is a degree of disagreement amongst analysts, with the most bullish reporting a price target of $120.0, and the most bearish reporting a price target of just $62.0.
Curious what kind of revenue path and margin profile need to hold for that valuation to stack up? The core of this narrative leans on steady top line expansion, firmer profitability, and a premium earnings multiple that stays above the broader specialty retail group. Want to see exactly how those assumptions combine to reach that fair value estimate?
Result: Fair Value of $110.20 (UNDERVALUED)
Have a read of the narrative in full and understand what's behind the forecasts.
However, this hinges on tariffs, supply chain stability and cost pressures, any of which could squeeze margins and challenge the upbeat earnings and same store sales story.
Find out about the key risks to this O'Reilly Automotive narrative.
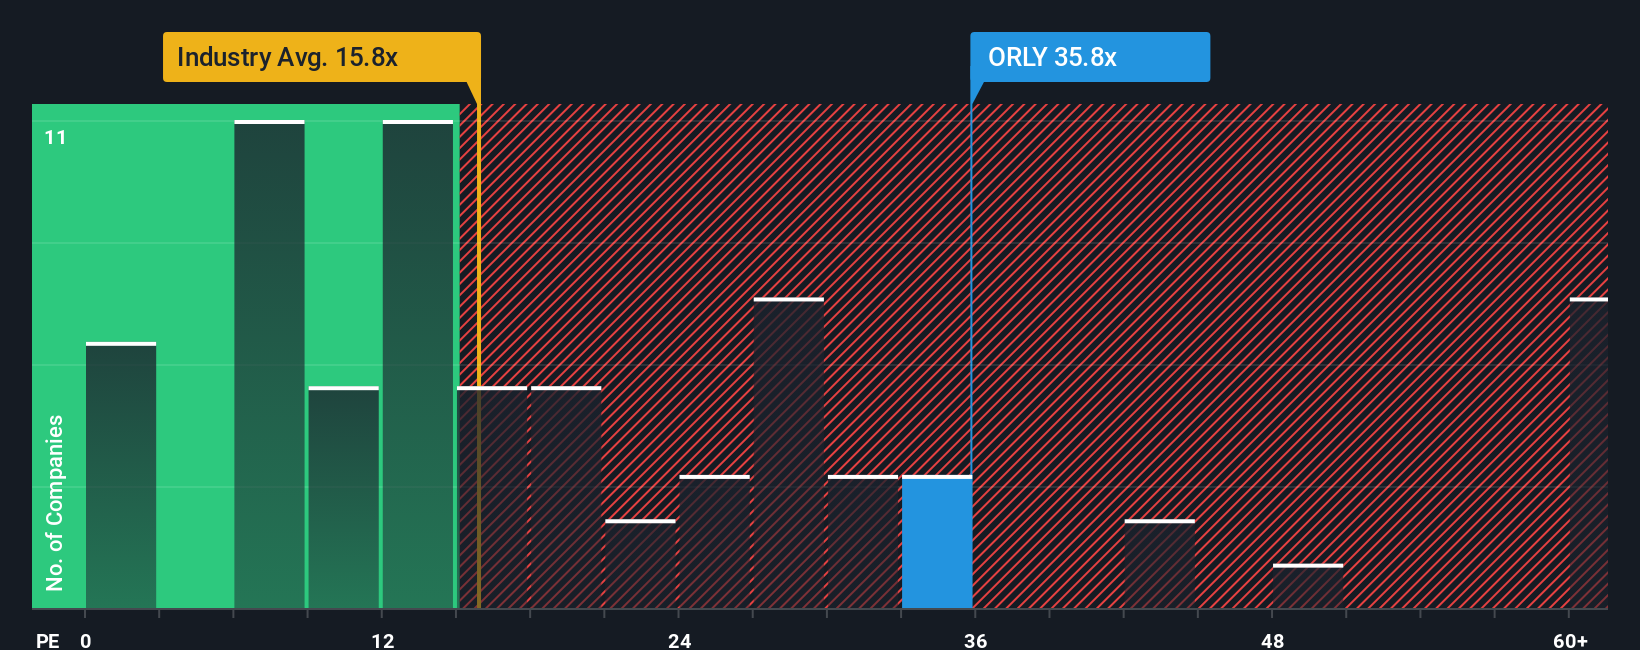
Another View: High P/E Points To Rich Pricing
The first narrative leans on analyst targets to suggest upside, but the preferred multiple tells a tighter story. O'Reilly trades on a P/E of 30.7x, which is below peers at 35.2x, yet well above the 20.2x industry average and a fair ratio of 19.2x.
That gap suggests investors are already paying a premium for quality and consistency. This can limit room for error if growth expectations cool. Do you see that premium as justified, or as valuation risk that could unwind if sentiment turns?
See what the numbers say about this price — find out in our valuation breakdown.
Simply Wall St performs a discounted cash flow (DCF) on every stock in the world every day (check out O'Reilly Automotive for example). We show the entire calculation in full. You can track the result in your watchlist or portfolio and be alerted when this changes, or use our stock screener to discover 875 undervalued stocks based on their cash flows. If you save a screener we even alert you when new companies match - so you never miss a potential opportunity.
Build Your Own O'Reilly Automotive Narrative
If you see the story differently, or want to test your own assumptions against the numbers, you can build a custom view in minutes, starting with Do it your way.
A great starting point for your O'Reilly Automotive research is our analysis highlighting 3 key rewards and 3 important warning signs that could impact your investment decision.
Looking for more investment ideas?
If O'Reilly Automotive is on your radar, it makes sense to widen the net and size up a few more opportunities before you commit fresh capital.
- Spot companies that trade below what their cash flows suggest they might be worth by scanning these 875 undervalued stocks based on cash flows for potential value ideas.
- Catch early movers in artificial intelligence by checking out these 25 AI penny stocks that are tying real business models to practical AI use cases.
- Tap into the search for income by scanning these 11 dividend stocks with yields > 3% that offer yields above 3% while still passing basic fundamental checks.
This article by Simply Wall St is general in nature. We provide commentary based on historical data and analyst forecasts only using an unbiased methodology and our articles are not intended to be financial advice. It does not constitute a recommendation to buy or sell any stock, and does not take account of your objectives, or your financial situation. We aim to bring you long-term focused analysis driven by fundamental data. Note that our analysis may not factor in the latest price-sensitive company announcements or qualitative material. Simply Wall St has no position in any stocks mentioned.
Have feedback on this article? Concerned about the content? Get in touch with us directly. Alternatively, email editorial-team@simplywallst.com