
- PREMIUM
- LIVE QUOTES
- INSTITUTIONS
 Index Options
 State Street
 CME Group
 Nasdaq
 Cboe
Cboe TradingView
 Wall Street Journal
Is Samsara (IOT) Fairly Priced After Recent Share Price Pullback?
- If you are wondering whether Samsara is still reasonably priced after its recent run as an Internet of Things software name, you are not alone. This article focuses squarely on what you might be paying for each dollar of its business.
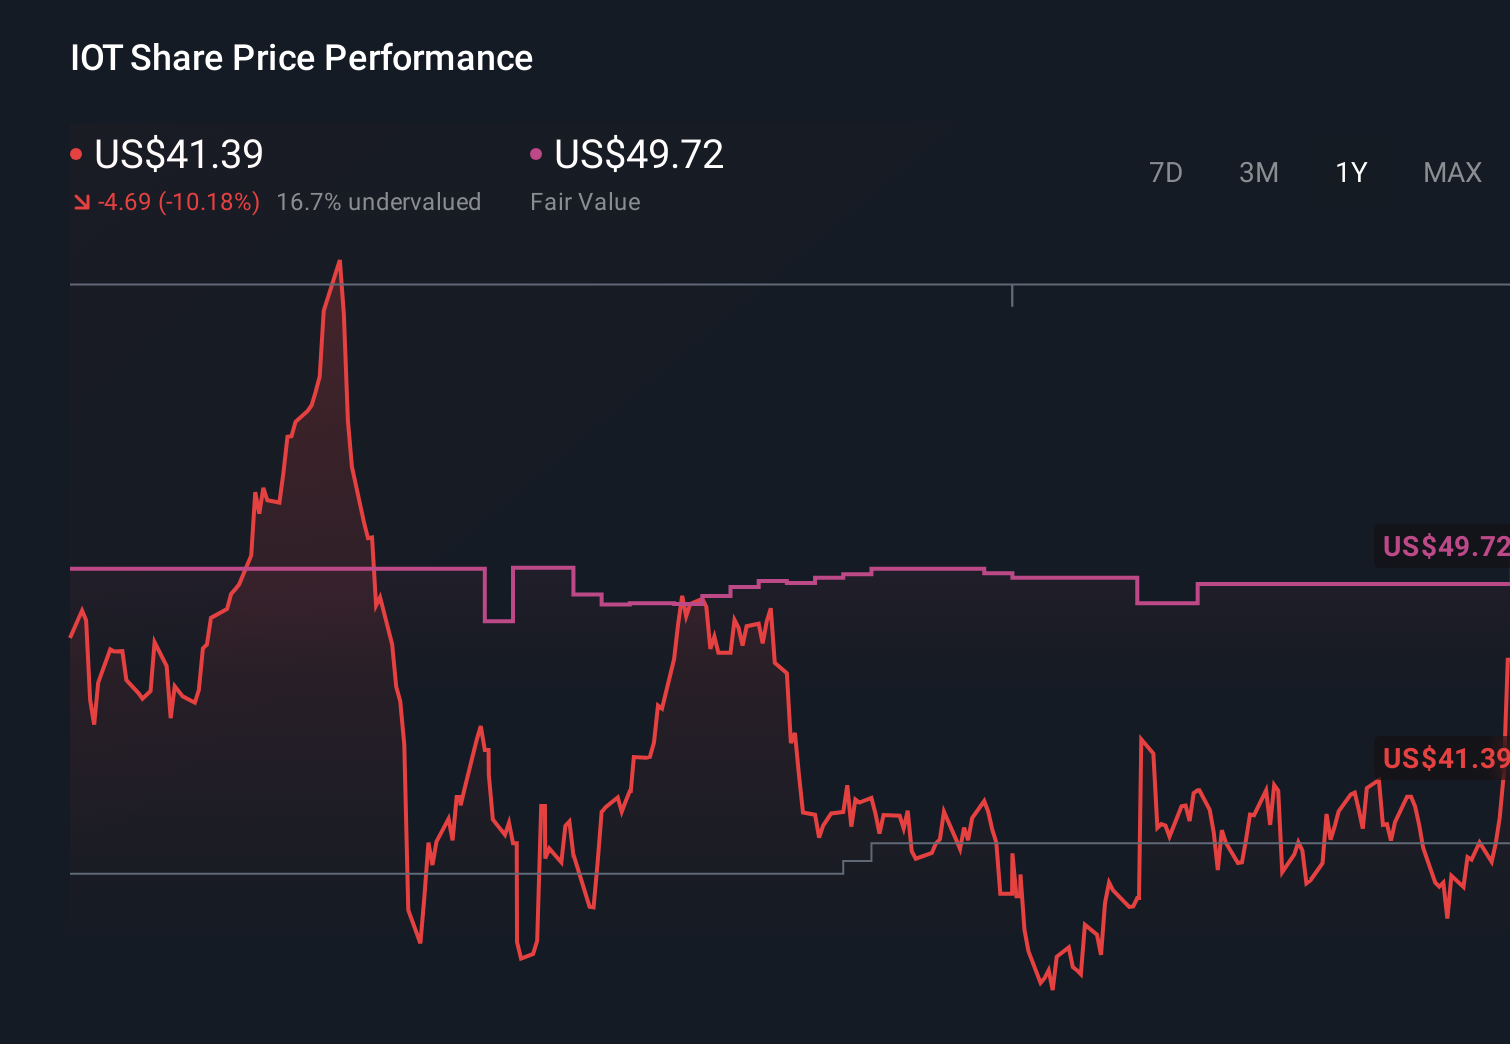
- Samsara shares last closed at US$34.96, with returns of a 2.8% decline over 7 days, a 22.7% decline over 30 days, a 3.1% gain year to date and an 18.5% decline over 1 year, while the 3 year return sits at a 206.1% gain.
- Recent coverage of Samsara has focused on its position as an Internet of Things and connected operations platform, which helps explain why expectations and risk perceptions around the stock have shifted over time. Commentary has highlighted how its software and data platform fits into broader trends in connected fleets, safety and efficiency, giving more context to the share price swings you might be seeing.
- On our framework, Samsara scores a 1 out of 6 valuation score, as it screens as undervalued on 1 of 6 checks. Next we will look at what traditional approaches like multiples and cash flow models can tell you about that pricing, before finishing with a more rounded way to think about value.
Samsara scores just 1/6 on our valuation checks. See what other red flags we found in the full valuation breakdown.
Approach 1: Samsara Discounted Cash Flow (DCF) Analysis
A Discounted Cash Flow, or DCF, model takes estimates of the cash a company may generate in the future and discounts those cash flows back to today, to arrive at an estimate of what the business might be worth right now.
For Samsara, the model used is a 2 Stage Free Cash Flow to Equity approach, based on cash flow projections. The company’s last twelve months free cash flow is about $195.6 million. Analysts provide explicit forecasts for the next few years, and Simply Wall St then extends those estimates further out, with projected free cash flow reaching $1.60b in 2035 in the current model.
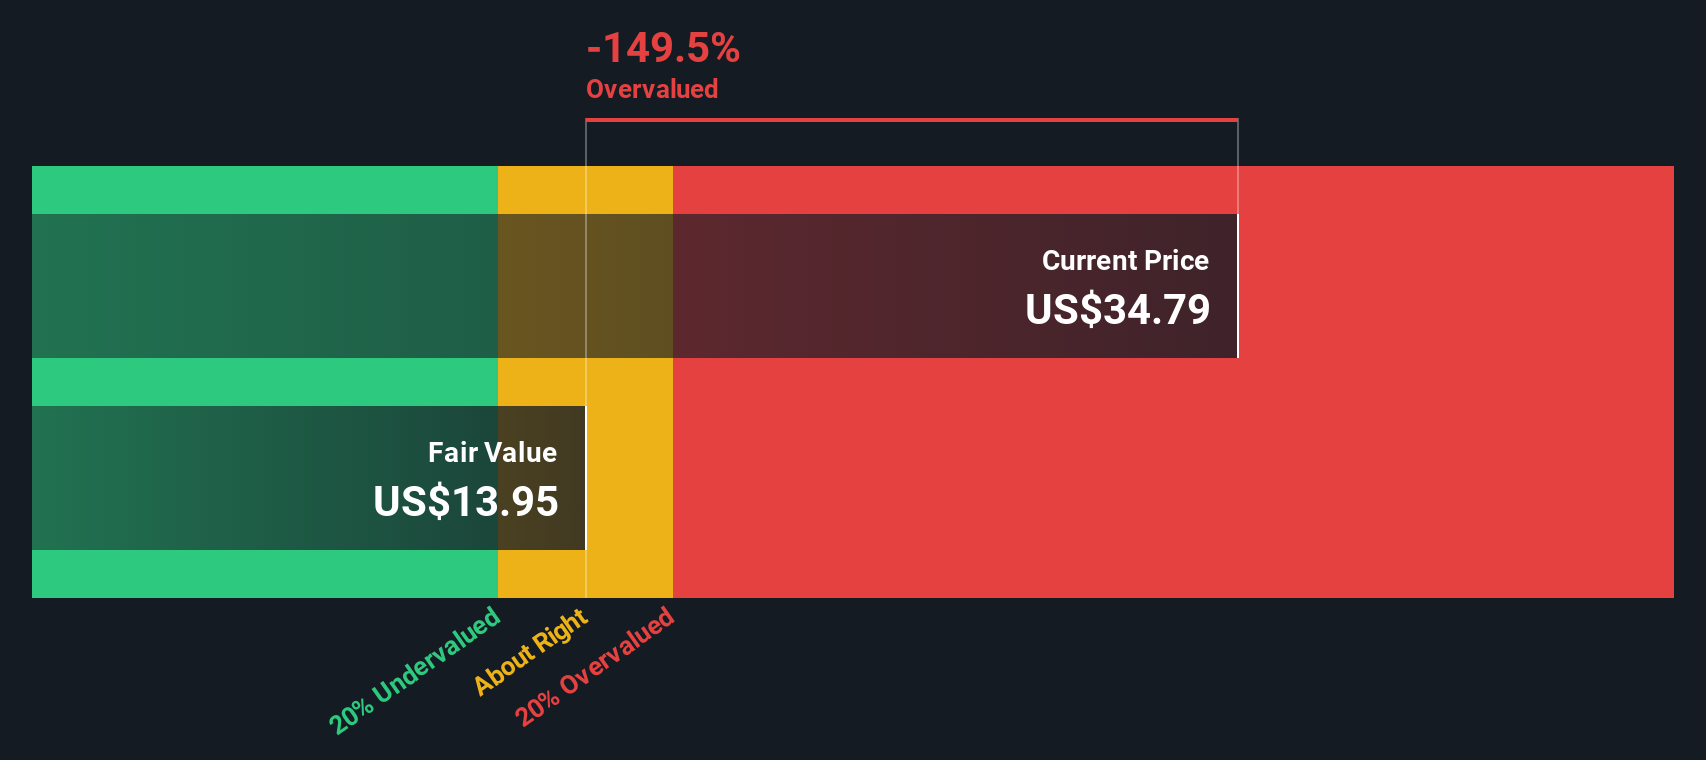
When all of those projected cash flows are discounted back to today and divided by the number of shares, the DCF model points to an estimated intrinsic value of about $33.64 per share. Compared with the recent share price of US$34.96, this suggests Samsara trades at roughly a 3.9% premium to this DCF estimate, which is a relatively small gap.
Result: ABOUT RIGHT
Samsara is fairly valued according to our Discounted Cash Flow (DCF), but this can change at a moment's notice. Track the value in your watchlist or portfolio and be alerted on when to act.
Approach 2: Samsara Price vs Sales
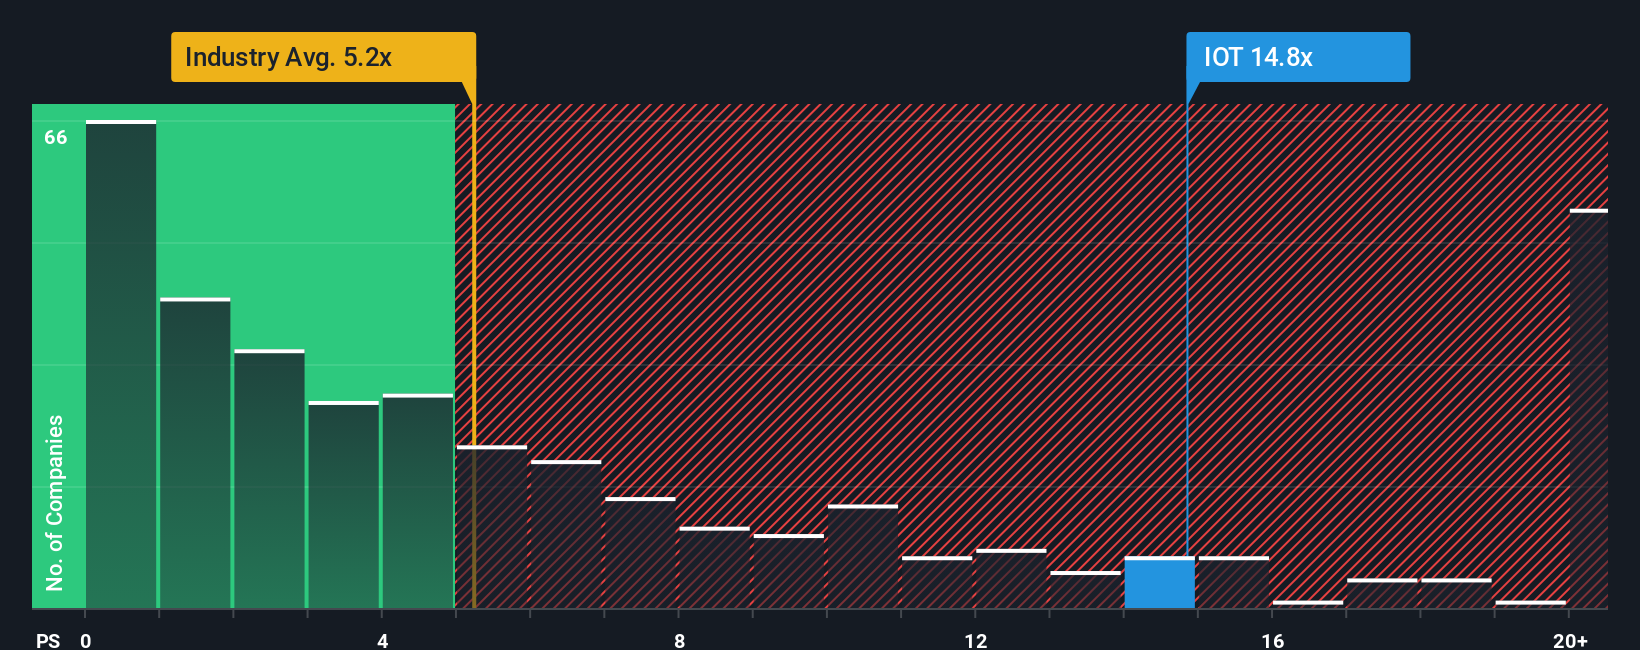
For a business like Samsara where investors often focus on revenue rather than earnings, the P/S multiple is a common way to think about what you are paying for each dollar of sales. It reflects how the market weighs factors such as expected growth and perceived risk, with higher growth and lower risk typically associated with a higher “normal” multiple.
Samsara currently trades on a P/S ratio of 13.27x. That sits above the broader Software industry average of 4.82x and also above the peer average of 8.85x. Simply Wall St’s Fair Ratio framework goes a step further and estimates what a more tailored P/S multiple could be, given inputs like Samsara’s earnings growth profile, industry, profit margins, market cap and risk characteristics. This Fair Ratio for Samsara is 9.94x.
Because the Fair Ratio is built around the company’s own fundamentals rather than just broad group comparisons, it can offer a more targeted reference point than industry or peer averages alone. On that basis, Samsara’s current P/S of 13.27x sits above the Fair Ratio of 9.94x, which points to the shares trading at a richer level on this metric.
Result: OVERVALUED
P/S ratios tell one story, but what if the real opportunity lies elsewhere? Discover 1447 companies where insiders are betting big on explosive growth.
Upgrade Your Decision Making: Choose your Samsara Narrative
Earlier we mentioned that there is an even better way to understand valuation. Narratives on Simply Wall St let you connect your view of Samsara’s story to specific forecasts for revenue, earnings and margins, translate that into a fair value, and then compare it with today’s share price. Each Narrative lives on the Community page, updates as fresh news or earnings arrive, and reflects different viewpoints, such as one investor who sees Samsara as worth about US$60.00 per share and another who sees closer to US$38.00. This gives you a clear, side by side sense of how different assumptions lead to different decisions about when a price may look attractive or expensive.
Do you think there's more to the story for Samsara? Head over to our Community to see what others are saying!
This article by Simply Wall St is general in nature. We provide commentary based on historical data and analyst forecasts only using an unbiased methodology and our articles are not intended to be financial advice. It does not constitute a recommendation to buy or sell any stock, and does not take account of your objectives, or your financial situation. We aim to bring you long-term focused analysis driven by fundamental data. Note that our analysis may not factor in the latest price-sensitive company announcements or qualitative material. Simply Wall St has no position in any stocks mentioned.
Have feedback on this article? Concerned about the content? Get in touch with us directly. Alternatively, email editorial-team@simplywallst.com