
- PREMIUM
- LIVE QUOTES
- INSTITUTIONS
 Index Options
 State Street
 CME Group
 Nasdaq
 Cboe
Cboe TradingView
 Wall Street Journal
Is It Too Late To Consider IAMGOLD (TSX:IMG) After A 195% One Year Surge?
- If you are wondering whether IAMGOLD is still reasonably priced after its recent run, this article walks through what the current share price might be implying about value.
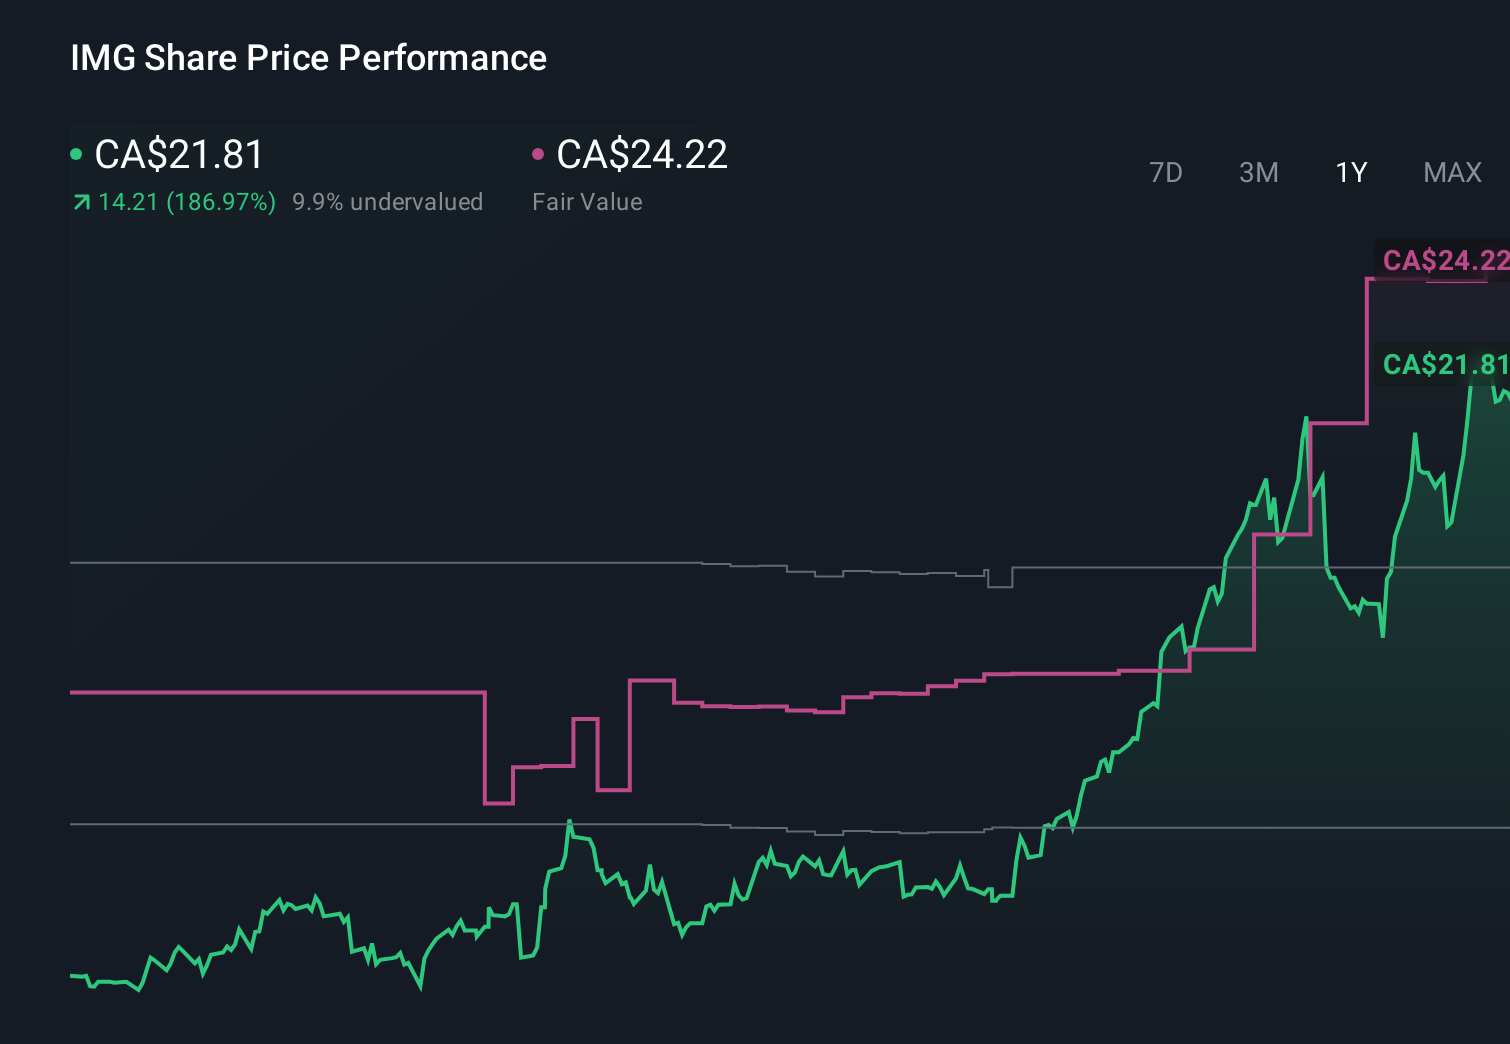
- The stock last closed at C$23.24, with returns of 1.4% over 7 days, 10.0% over 30 days, 4.5% year to date and 194.6% over the past year. The 3 year and 5 year returns are both very large.
- Recent attention on gold producers has kept IAMGOLD in focus, as investors weigh how company specific developments and sector sentiment relate to its share price. That backdrop gives important context when you are trying to work out whether current pricing still lines up with fundamentals.
- On our valuation checks, IAMGOLD scores 4 out of 6. Next we will look at what different valuation methods suggest about the stock, before finishing with a more complete way to think about value that pulls the whole picture together.
Approach 1: IAMGOLD Discounted Cash Flow (DCF) Analysis
A Discounted Cash Flow model projects the cash the business might generate in the future and then discounts those cash flows back to today to estimate what the company could be worth now.
For IAMGOLD, the model used is a 2 Stage Free Cash Flow to Equity approach, based on cash flow projections in $. The latest twelve month free cash flow is a loss of $457.50 million. Analysts provide cash flow estimates for the next few years, and Simply Wall St then extends those to a full 10 year path.
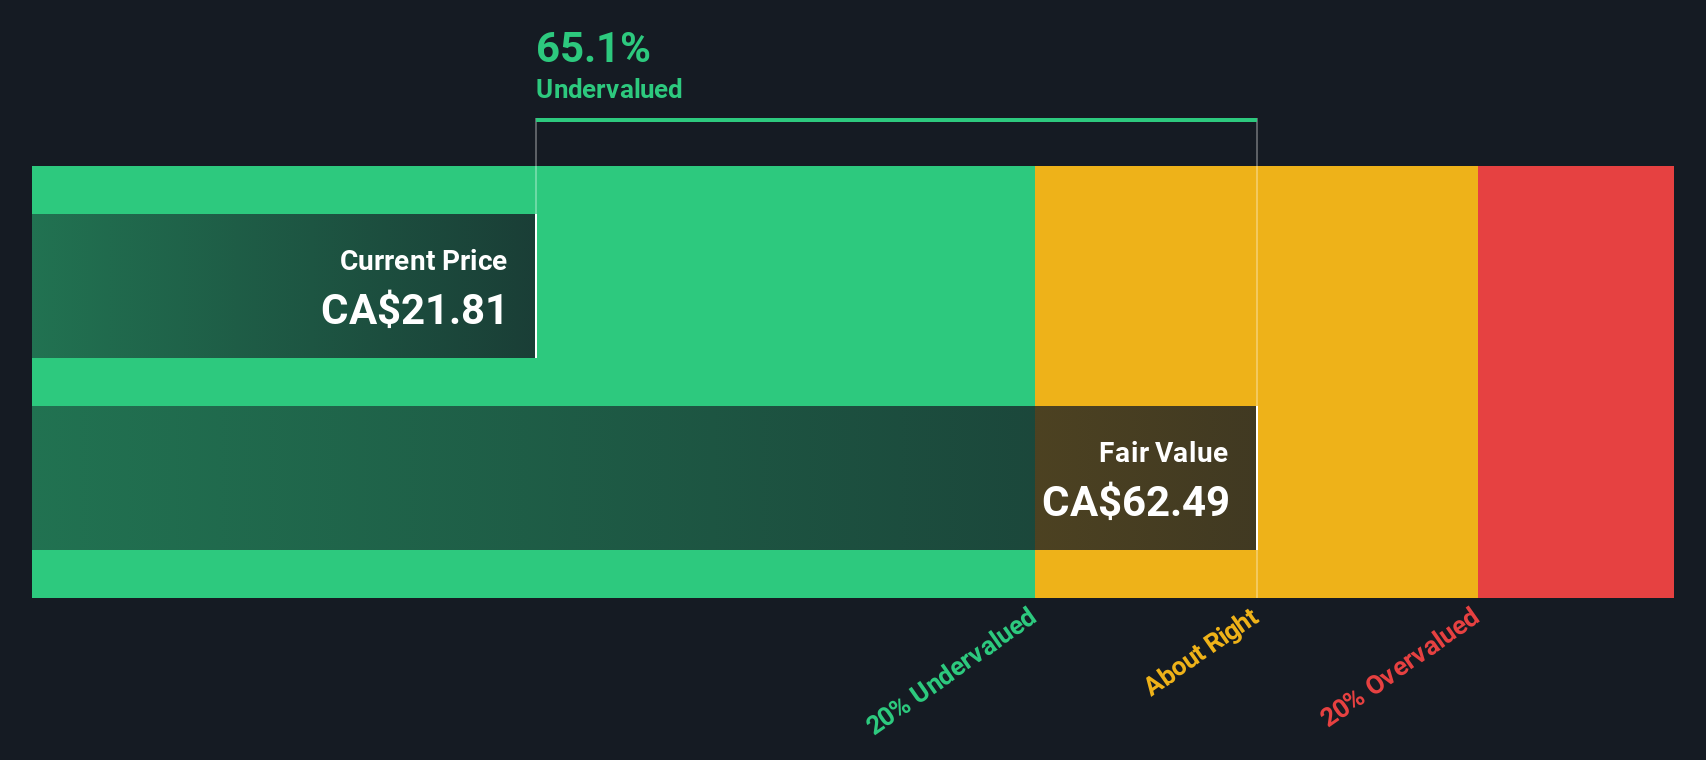
Across these projections, free cash flow is expected in the hundreds of millions of dollars per year, with an example figure of $1,487.84 million in 2035, discounted back to $727.60 million. Each future year is discounted in this way and then summed to arrive at an estimated intrinsic value of $62.53 per share.
Compared to the current share price of CA$23.24, the DCF outcome implies IAMGOLD trades at a 62.8% discount, which suggests the shares appear undervalued on this model alone.
Result: UNDERVALUED
Our Discounted Cash Flow (DCF) analysis suggests IAMGOLD is undervalued by 62.8%. Track this in your watchlist or portfolio, or discover 875 more undervalued stocks based on cash flows.
Approach 2: IAMGOLD Price vs Earnings
For profitable companies, the P/E ratio is a useful way to connect what you are paying for each share with the earnings that support it. It gives you a quick sense of how many years of current earnings the market is effectively pricing in.
What counts as a "normal" P/E depends on how fast earnings are expected to grow and how risky those earnings look. Higher growth and lower perceived risk can justify a higher multiple, while slower growth or higher risk usually calls for a lower one.
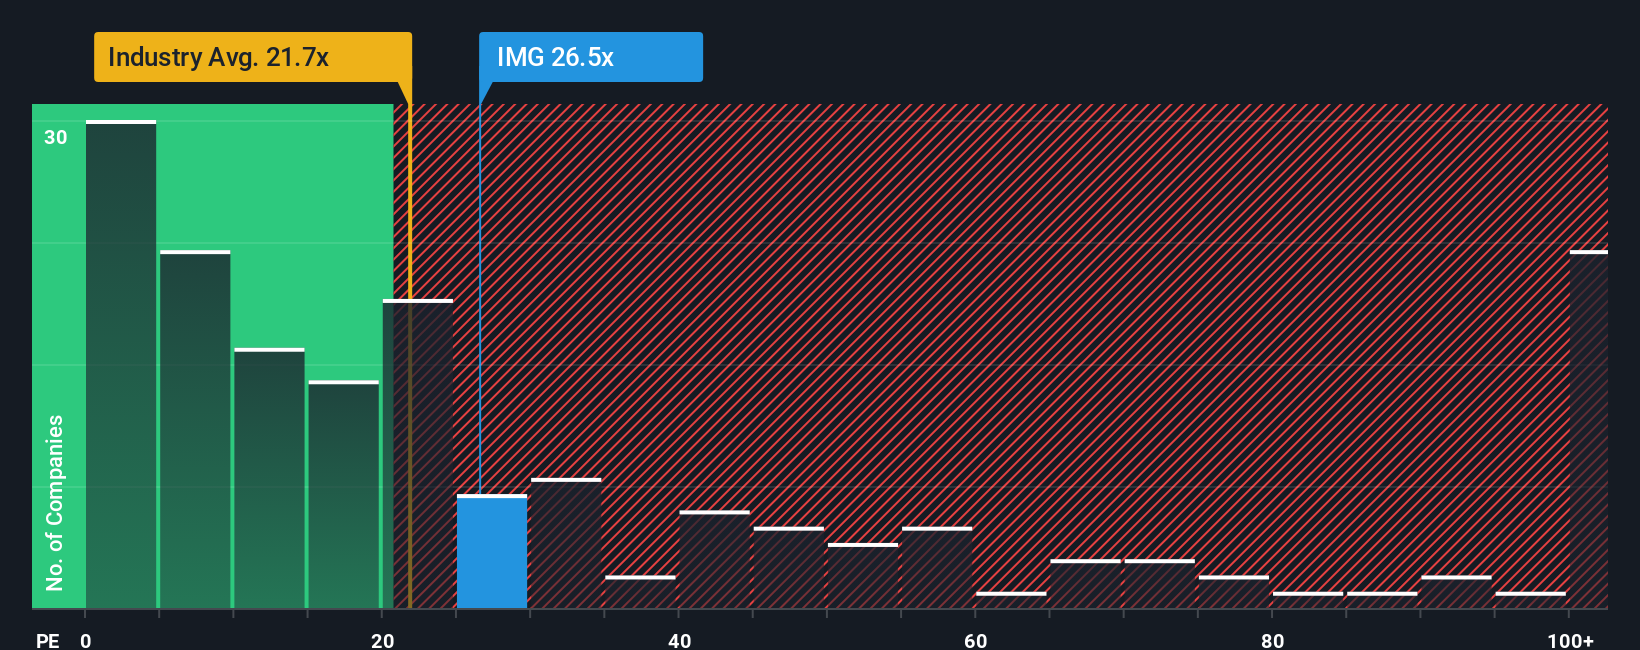
IAMGOLD currently trades on a P/E of 28.2x. That sits above the Metals and Mining industry average of about 23.3x, but well below the peer group average of 66.3x. Simply Wall St also calculates a Fair Ratio for IAMGOLD of 44.2x, which is the P/E level that would typically line up with its earnings growth profile, industry, margins, market cap and risk characteristics.
This Fair Ratio is more tailored than a simple comparison with peers or the broad industry, because it factors in company specific growth, risks and profitability as well as sector and size. When set against the current P/E of 28.2x, the Fair Ratio of 44.2x suggests IAMGOLD shares look undervalued on this metric.
Result: UNDERVALUED
P/E ratios tell one story, but what if the real opportunity lies elsewhere? Discover 1447 companies where insiders are betting big on explosive growth.
Upgrade Your Decision Making: Choose your IAMGOLD Narrative
Earlier we mentioned that there is an even better way to understand valuation. Narratives let you turn your view of IAMGOLD into a clear story that links what you think will happen to its revenue, earnings and margins, to a financial forecast and then to a fair value estimate you can compare with the current price.
On Simply Wall St’s Community page, millions of investors use Narratives as an easy tool where you set your own assumptions, see the implied fair value, and then decide whether the current CA$23.24 share price looks high, low or roughly in line with your story.
Because Narratives are updated automatically when new information arrives, such as the normal course issuer bid of up to 57,000,000 shares or analyst fair value changes around CA$24.69 per share, your view stays connected to the latest data without you rebuilding your work each time.
For example, one IAMGOLD investor might focus on higher expected revenue growth of about 11.7%, a profit margin near 30.3% and see fair value close to CA$24.69, while another might lean on the more cautious analyst earnings and price targets as a ceiling, and both can quickly see how their different stories translate into different fair values relative to today’s price.
Do you think there's more to the story for IAMGOLD? Head over to our Community to see what others are saying!
This article by Simply Wall St is general in nature. We provide commentary based on historical data and analyst forecasts only using an unbiased methodology and our articles are not intended to be financial advice. It does not constitute a recommendation to buy or sell any stock, and does not take account of your objectives, or your financial situation. We aim to bring you long-term focused analysis driven by fundamental data. Note that our analysis may not factor in the latest price-sensitive company announcements or qualitative material. Simply Wall St has no position in any stocks mentioned.
Have feedback on this article? Concerned about the content? Get in touch with us directly. Alternatively, email editorial-team@simplywallst.com