
- PREMIUM
- LIVE QUOTES
- INSTITUTIONS
 Index Options
 State Street
 CME Group
 Nasdaq
 Cboe
Cboe TradingView
 Wall Street Journal
Is PROG Holdings (PRG) Share Price Around US$30 Signaling A Mispriced Opportunity?
- Wondering if PROG Holdings at around US$30.40 is priced for opportunity or risk? This article walks through what the current share price could mean for you.
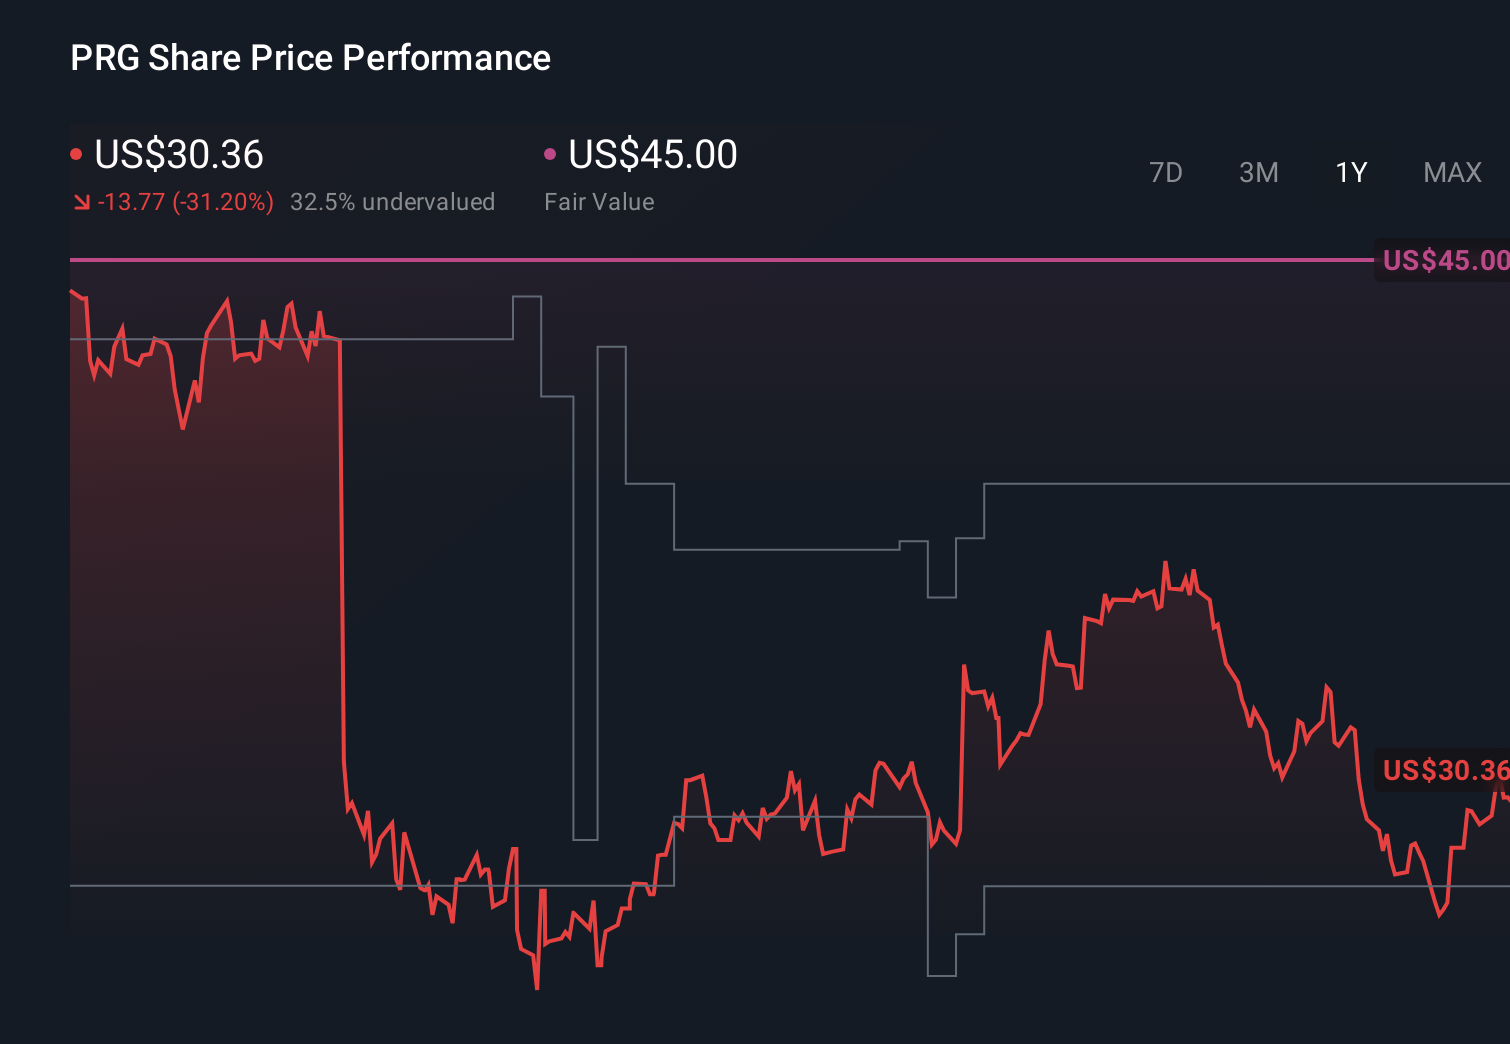
- The stock has recently posted a 0.4% return over 7 days, 2.8% over 30 days, 3.5% year to date, a 26.7% decline over 1 year, a 65.7% gain over 3 years and a 42.5% decline over 5 years, which gives a mixed picture of how the market has treated the company over different time frames.
- These moves sit against a backdrop of ongoing attention on PROG Holdings as a diversified financials name on the NYSE, where investors frequently reassess risk and reward as conditions shift across the sector. While there has not been a single headline event driving all of these returns, the share price history itself raises questions about whether expectations have become too low or too high at different points.
- On our six point valuation checklist, PROG Holdings scores 5 out of 6, suggesting it screens as undervalued on most of the tests we run. Next, we will walk through the main valuation approaches investors often use before finishing with a more complete way to think about what the stock might be worth.
Find out why PROG Holdings's -26.7% return over the last year is lagging behind its peers.
Approach 1: PROG Holdings Excess Returns Analysis
The Excess Returns model looks at how much profit a company is expected to earn above the return that shareholders require, based on the capital invested in the business. Instead of focusing on cash flows alone, it asks whether each dollar of equity is expected to earn more than its cost over time.
For PROG Holdings, the model uses a Book Value of $17.79 per share and a Stable EPS of $3.17 per share, based on the median return on equity from the past 5 years. The Average Return on Equity is 23.39%, compared with a Cost of Equity of $1.23 per share. This leads to an estimated Excess Return of $1.94 per share. A Stable Book Value of $13.55 per share, taken from the median book value over 5 years, is used to anchor these assumptions.
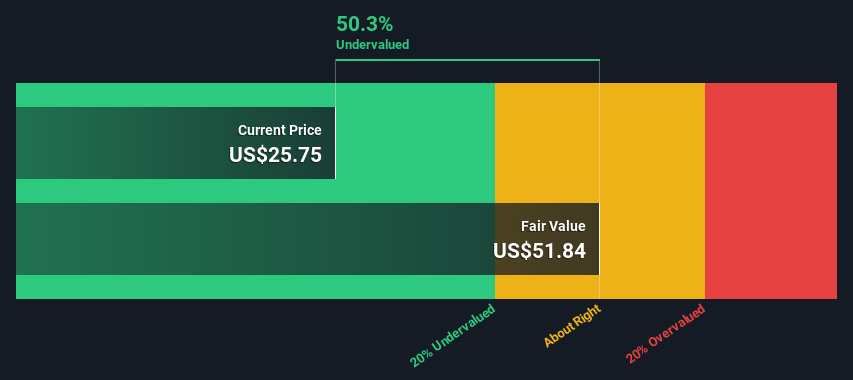
Putting this together, the Excess Returns model yields an estimated intrinsic value of about $46.98 per share. Against a current share price around $30.40, this points to the stock trading at roughly a 35.3% discount, which screens as meaningfully undervalued on this approach.
Result: UNDERVALUED
Our Excess Returns analysis suggests PROG Holdings is undervalued by 35.3%. Track this in your watchlist or portfolio, or discover 875 more undervalued stocks based on cash flows.
Approach 2: PROG Holdings Price vs Earnings
For a profitable company like PROG Holdings, the P/E ratio is a useful shorthand for what you are paying for each dollar of earnings. It lets you compare the stock to other companies quickly, while still tying the valuation back to actual profitability rather than just revenue or assets.
What counts as a “normal” P/E depends a lot on what investors expect from future growth and how much risk they see in the business. Higher expected growth or lower perceived risk can justify a higher multiple, while lower growth or higher risk usually lines up with a lower one.
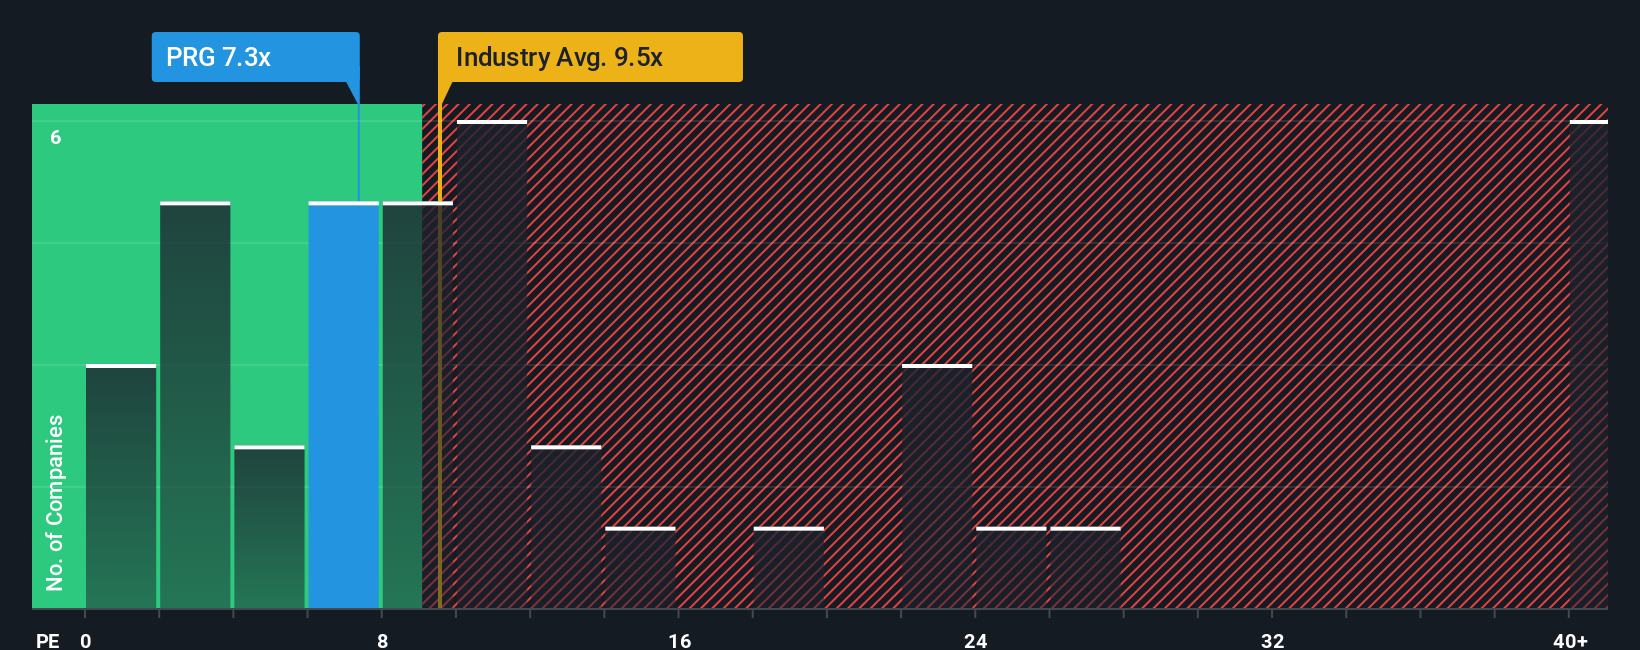
PROG Holdings currently trades on a P/E of 7.34x. That is below both the Consumer Finance industry average of 9.60x and the peer average of 8.07x. Simply Wall St’s Fair Ratio for PROG Holdings is 13.91x, which is its view of the P/E that could be reasonable given factors such as earnings growth, industry, profit margin, market cap and company specific risks.
The Fair Ratio goes further than a simple peer or industry comparison because it adjusts for those fundamentals rather than just lining the company up against broad averages. With the current 7.34x P/E below the 13.91x Fair Ratio, this approach suggests that the shares may be undervalued on earnings.
Result: UNDERVALUED
P/E ratios tell one story, but what if the real opportunity lies elsewhere? Discover 1447 companies where insiders are betting big on explosive growth.
Upgrade Your Decision Making: Choose your PROG Holdings Narrative
Earlier we mentioned that there is an even better way to think about valuation, and on Simply Wall St that means using Narratives. These let you spell out your story for PROG Holdings in plain language, connect it to your own assumptions for future revenue, earnings and margins, turn that into a fair value, and then compare that fair value to the current price on the Community page. Narratives are refreshed when new news or earnings arrive. One investor might build a bullish PROG Holdings Narrative around catalysts such as growth in digital payment solutions, omnichannel partnerships, improving credit quality and a consensus fair value around US$38.57. Another might focus on risks like soft demand, regulatory scrutiny and partner concentration and land closer to the more cautious US$27 view. This gives you a clear, numbers backed way to decide whether the stock looks like an opportunity or a risk based on your own perspective.
Do you think there's more to the story for PROG Holdings? Head over to our Community to see what others are saying!
This article by Simply Wall St is general in nature. We provide commentary based on historical data and analyst forecasts only using an unbiased methodology and our articles are not intended to be financial advice. It does not constitute a recommendation to buy or sell any stock, and does not take account of your objectives, or your financial situation. We aim to bring you long-term focused analysis driven by fundamental data. Note that our analysis may not factor in the latest price-sensitive company announcements or qualitative material. Simply Wall St has no position in any stocks mentioned.
Have feedback on this article? Concerned about the content? Get in touch with us directly. Alternatively, email editorial-team@simplywallst.com