
- PREMIUM
- LIVE QUOTES
- INSTITUTIONS
 Index Options
 State Street
 CME Group
 Nasdaq
 Cboe
Cboe TradingView
 Wall Street Journal
Is Installed Building Products (IBP) Pricing Too High After Strong Multi‑Year Share Gains?
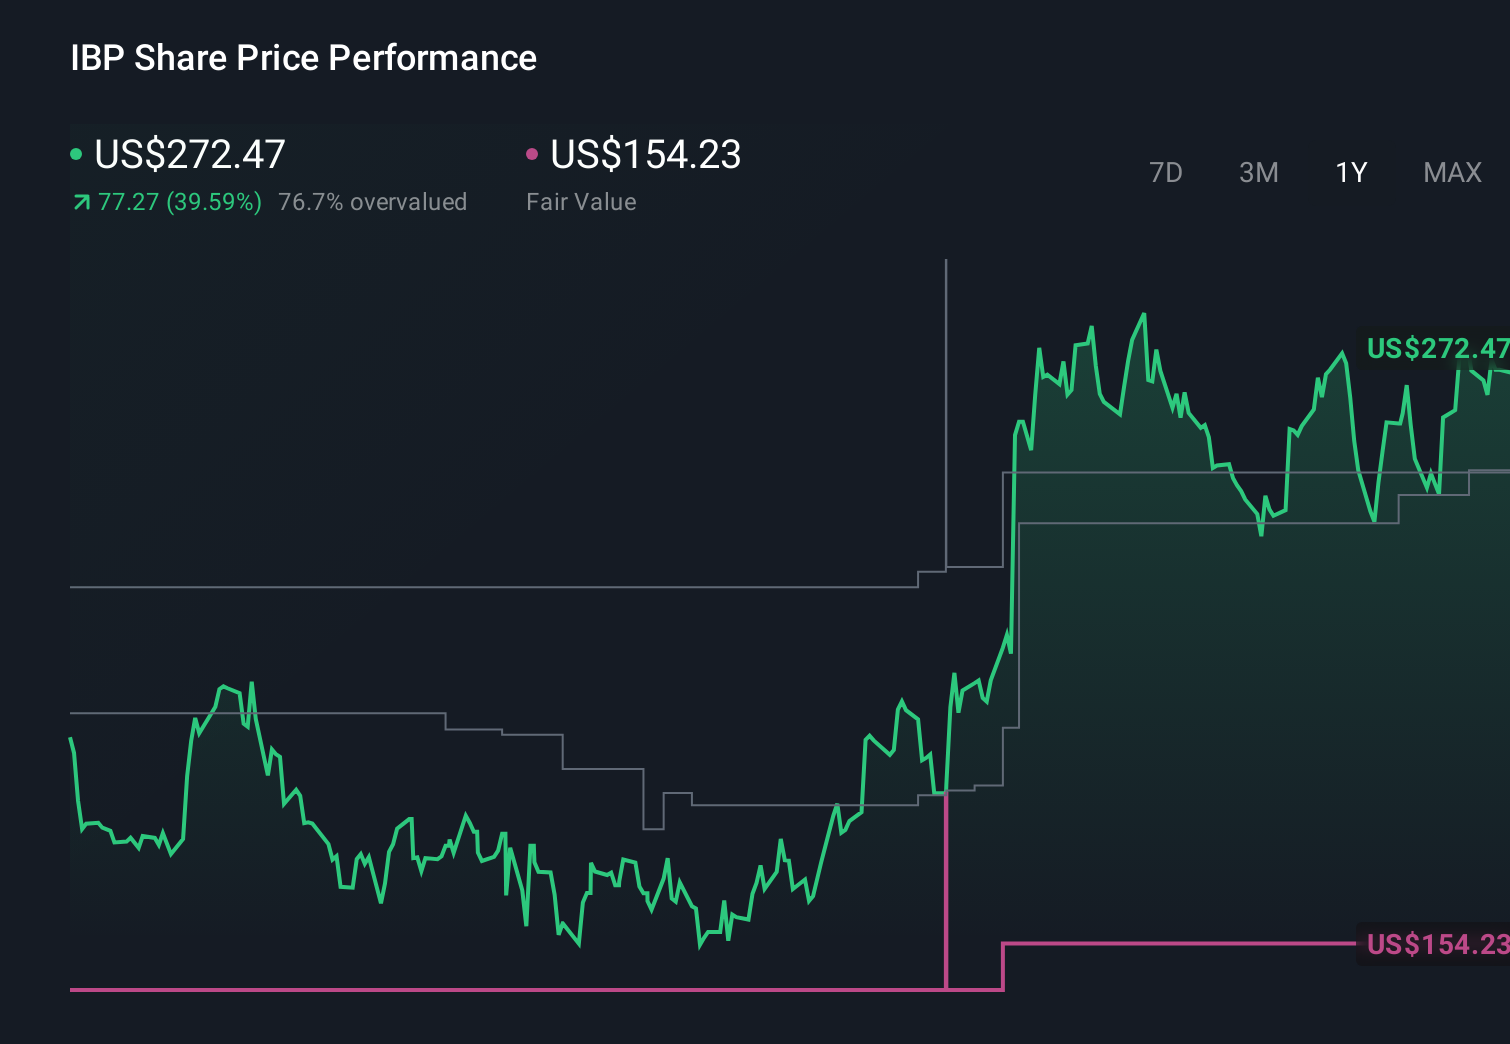
- If you are wondering whether Installed Building Products at around US$275.78 is a fair price or a stretch, you are in the right place for a clear look at what that tag might really represent.
- The stock has posted returns of 4.3% over the last 7 days, 2.8% over the last 30 days, 3.1% year to date, 61.4% over 1 year, 212.2% over 3 years and 171.5% over 5 years, which naturally raises questions about how much of this performance is already reflected in the current valuation.
- Recent coverage has focused on how Installed Building Products continues to be part of investor conversations around the building products space, with attention on how its business model fits into broader housing and construction trends. This context helps explain why the share price has been active and why investors are looking more closely at what they are paying for each dollar of the business.
- Our simple valuation framework gives Installed Building Products a score of 0/6. Next we will walk through what different valuation approaches say about that price tag and then finish with a more rounded way to think about value beyond the headline numbers.
Installed Building Products scores just 0/6 on our valuation checks. See what other red flags we found in the full valuation breakdown.
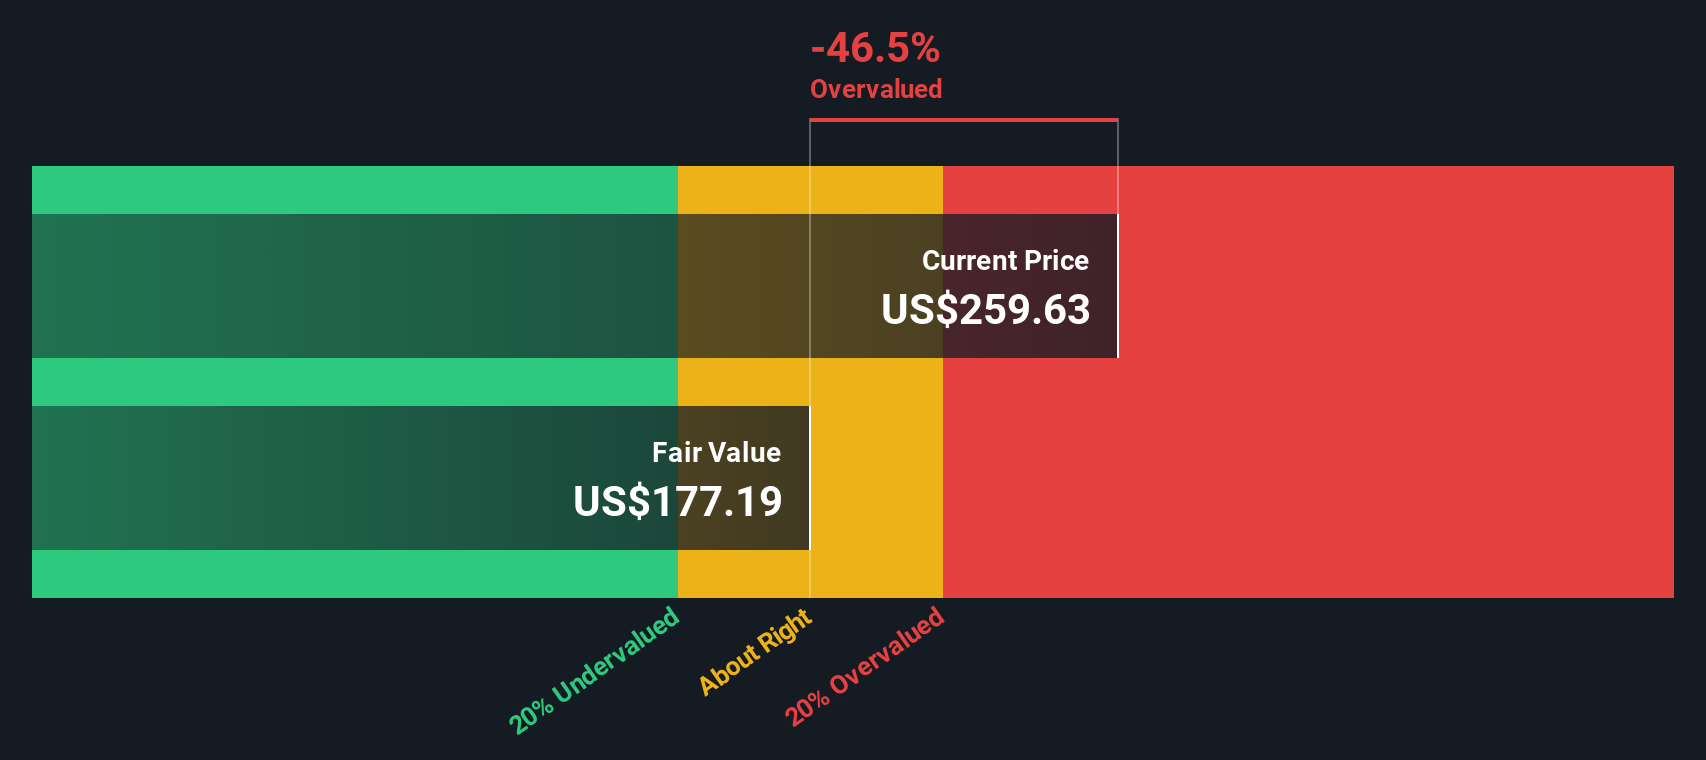
Approach 1: Installed Building Products Discounted Cash Flow (DCF) Analysis
A Discounted Cash Flow model takes forecasts of a company’s future cash flows, then discounts them back to today’s dollars to estimate what the whole business might be worth right now.
For Installed Building Products, the model uses a 2 stage Free Cash Flow to Equity approach based on cash flow projections. The latest twelve month free cash flow is about $307.0 million. Analysts supply forecasts out to 2027, with free cash flow for that year projected at $312.2 million, and Simply Wall St then extrapolates further out to 2035, reaching a projected $382.4 million in year ten.
After discounting these projected cash flows and adding a terminal value, the model arrives at an intrinsic value estimate of about $195.44 per share. Compared with the recent share price around $275.78, the DCF output suggests the stock is about 41.1% above this estimate, which points to a rich price tag based on these cash flow assumptions.
Result: OVERVALUED
Our Discounted Cash Flow (DCF) analysis suggests Installed Building Products may be overvalued by 41.1%. Discover 874 undervalued stocks or create your own screener to find better value opportunities.
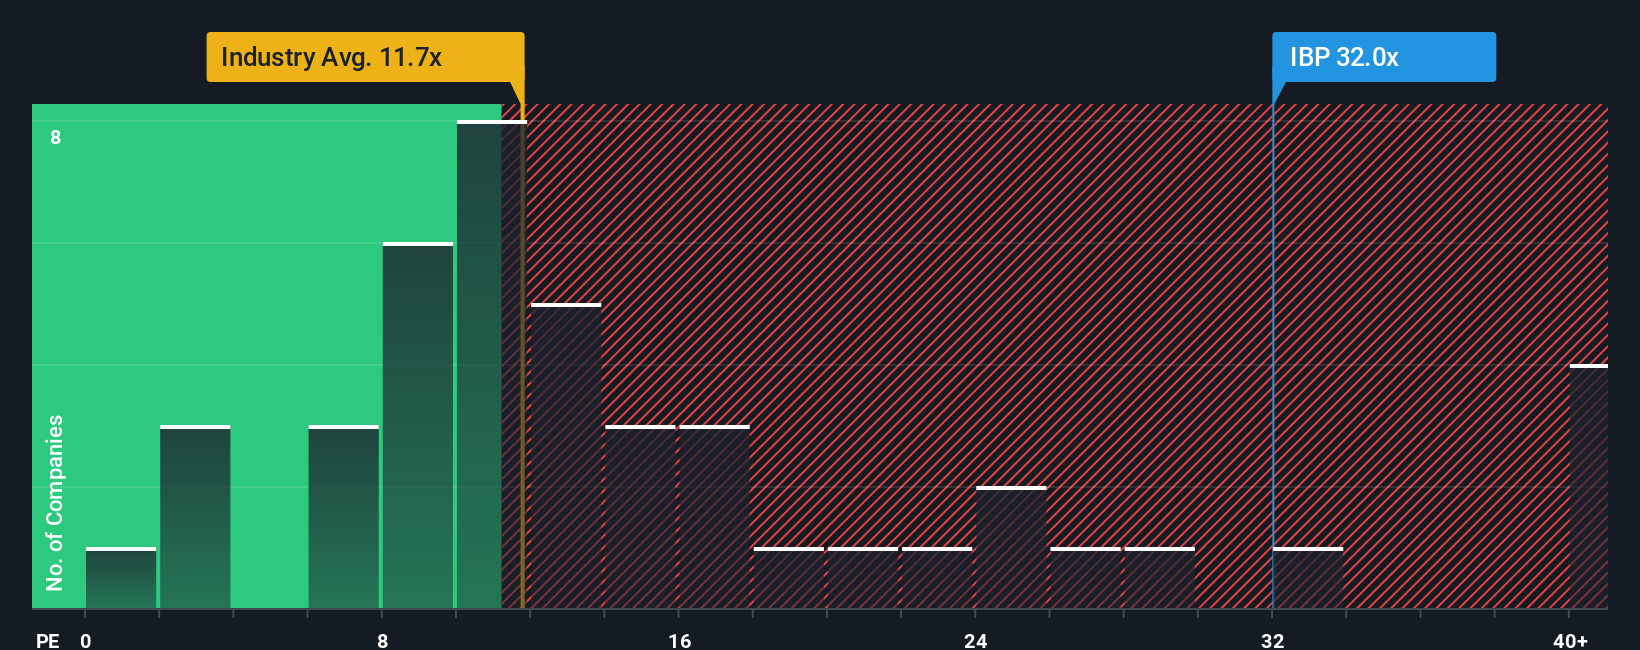
Approach 2: Installed Building Products Price vs Earnings
For profitable companies, the P/E ratio is a useful way to link what you are paying today with the earnings the business is currently generating. It helps you see how many dollars investors are willing to pay for each dollar of earnings.
What counts as a normal or fair P/E often reflects how the market views a company’s growth prospects and risk profile. Higher expected growth or lower perceived risk can support a higher P/E, while lower growth expectations or higher perceived risk tend to line up with a lower multiple.
Installed Building Products currently trades at a P/E of about 29.1x. That sits above the Consumer Durables industry average of around 10.4x and the peer group average of about 15.3x. Simply Wall St’s Fair Ratio for Installed Building Products is 15.4x, which is its view of an appropriate P/E once you factor in elements like earnings growth, profit margins, industry, market value and company specific risks.
This Fair Ratio can be more useful than a simple peer or industry comparison because it is tailored to the company’s own profile rather than relying on broad group averages. With the current P/E of 29.1x sitting well above the 15.4x Fair Ratio, the multiple based view suggests the shares are pricing in a lot.
Result: OVERVALUED
P/E ratios tell one story, but what if the real opportunity lies elsewhere? Discover 1450 companies where insiders are betting big on explosive growth.
Upgrade Your Decision Making: Choose your Installed Building Products Narrative
Earlier we mentioned that there is an even better way to understand valuation. On Simply Wall St’s Community page you can use Narratives, where you set your own story for Installed Building Products, link that story to specific assumptions for future revenue, earnings and margins, see how those assumptions roll into a Fair Value that you can compare with the current share price to help you assess the company, and then watch that Narrative update as new information such as earnings or news comes in. For example, one investor might build a cautious Installed Building Products Narrative around the US$184.00 bearish analyst target, while another leans into a more optimistic story closer to the US$290.00 bullish target, and both can see in real time how their different views translate into numbers.
Do you think there's more to the story for Installed Building Products? Head over to our Community to see what others are saying!
This article by Simply Wall St is general in nature. We provide commentary based on historical data and analyst forecasts only using an unbiased methodology and our articles are not intended to be financial advice. It does not constitute a recommendation to buy or sell any stock, and does not take account of your objectives, or your financial situation. We aim to bring you long-term focused analysis driven by fundamental data. Note that our analysis may not factor in the latest price-sensitive company announcements or qualitative material. Simply Wall St has no position in any stocks mentioned.
Have feedback on this article? Concerned about the content? Get in touch with us directly. Alternatively, email editorial-team@simplywallst.com