
- PREMIUM
- LIVE QUOTES
- INSTITUTIONS
 Index Options
 State Street
 CME Group
 Nasdaq
 Cboe
Cboe TradingView
 Wall Street Journal
Is TJX Companies (TJX) Still Attractive After Strong Multi‑Year Share Price Gains?
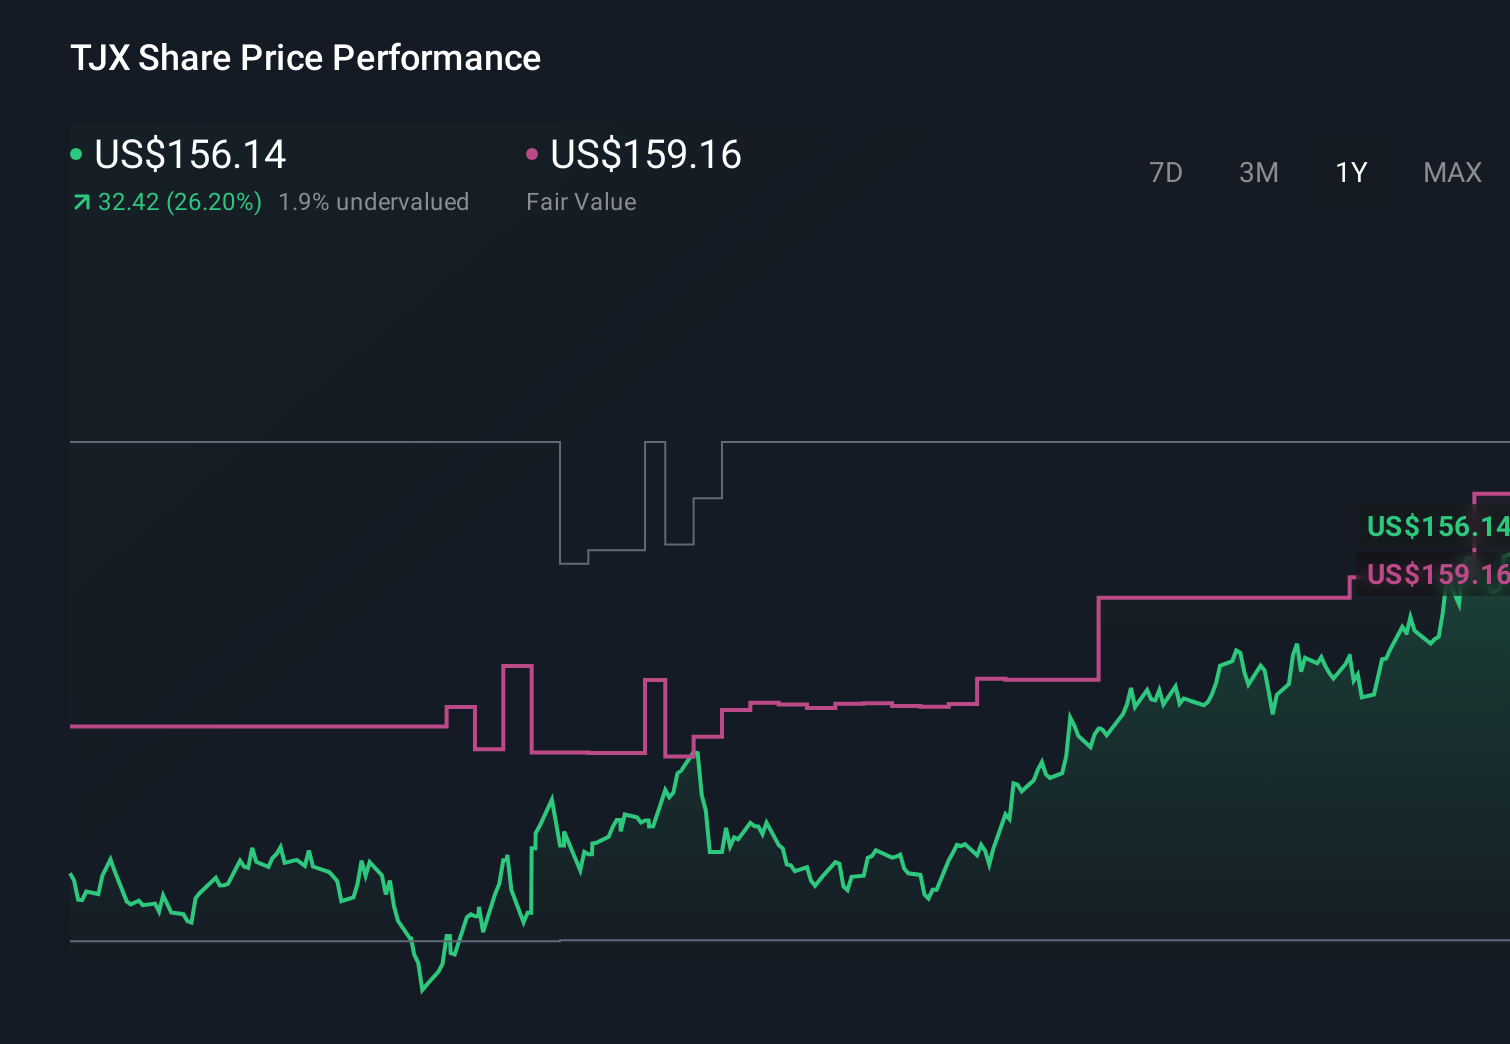
- If you are wondering whether TJX Companies at around US$153.92 is still a sensible entry point, or if the recent run has already priced in the good news, you are asking the right questions.
- The stock has been fairly steady in the short term, with a 0.9% decline over the last 7 days and a 0.4% gain over the last 30 days, while longer term returns of 29.7% over 1 year, 94.6% over 3 years and 142.3% over 5 years may catch your eye as you weigh growth potential against risk.
- Recent coverage of TJX has focused on its role as a major off price retailer and its position in the broader retail sector. This has kept attention on how its business model holds up through different spending patterns. That backdrop helps explain why investors keep revisiting the stock as they reassess what they are willing to pay for its earnings and cash flows.
- Simply Wall St currently gives TJX Companies a value score of 0/6, which means none of the six valuation checks flag the shares as undervalued. Next we will look at what traditional valuation tools can and cannot tell you, and then finish with a more complete way to think about what the stock might be worth.
TJX Companies scores just 0/6 on our valuation checks. See what other red flags we found in the full valuation breakdown.
Approach 1: TJX Companies Discounted Cash Flow (DCF) Analysis
A Discounted Cash Flow, or DCF, model estimates what a company might be worth today by projecting its future cash flows and then discounting those back to a present value. It is essentially asking what all those future dollars are worth in today’s terms.
For TJX Companies, the latest twelve months Free Cash Flow is reported at about $4.49b. Simply Wall St uses a 2 Stage Free Cash Flow to Equity model that incorporates analyst projections where available, then extends those forecasts. In this case, Free Cash Flow is projected to reach $7.12b by 2030, with intermediate annual figures, such as an estimated $4.61b in 2026 and $4.89b in 2027, all converted into today’s dollars using a discount rate.
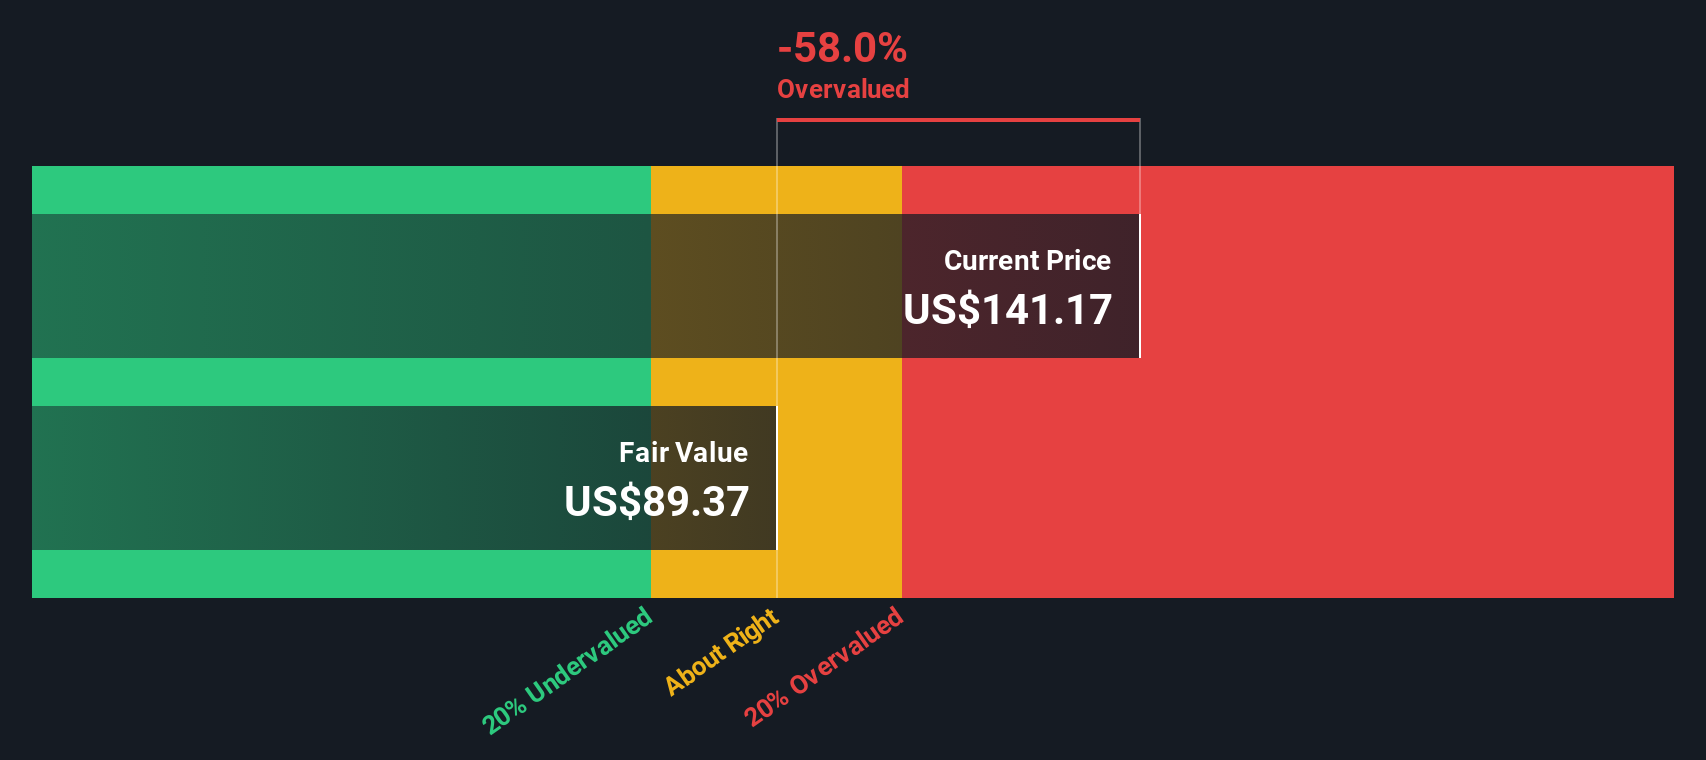
Adding these discounted cash flows together produces an estimated intrinsic value of about $106.50 per share. Compared with the current share price around $153.92, the DCF output suggests the stock is about 44.5% above this intrinsic estimate. This points to TJX trading on the expensive side based on this model alone.
Result: OVERVALUED
Our Discounted Cash Flow (DCF) analysis suggests TJX Companies may be overvalued by 44.5%. Discover 873 undervalued stocks or create your own screener to find better value opportunities.
Approach 2: TJX Companies Price vs Earnings
For a consistently profitable company like TJX Companies, the P/E ratio is a useful way to see what you are paying for each dollar of earnings. It captures how the market is weighing the company’s earnings power today against what it expects those earnings to be in the future.
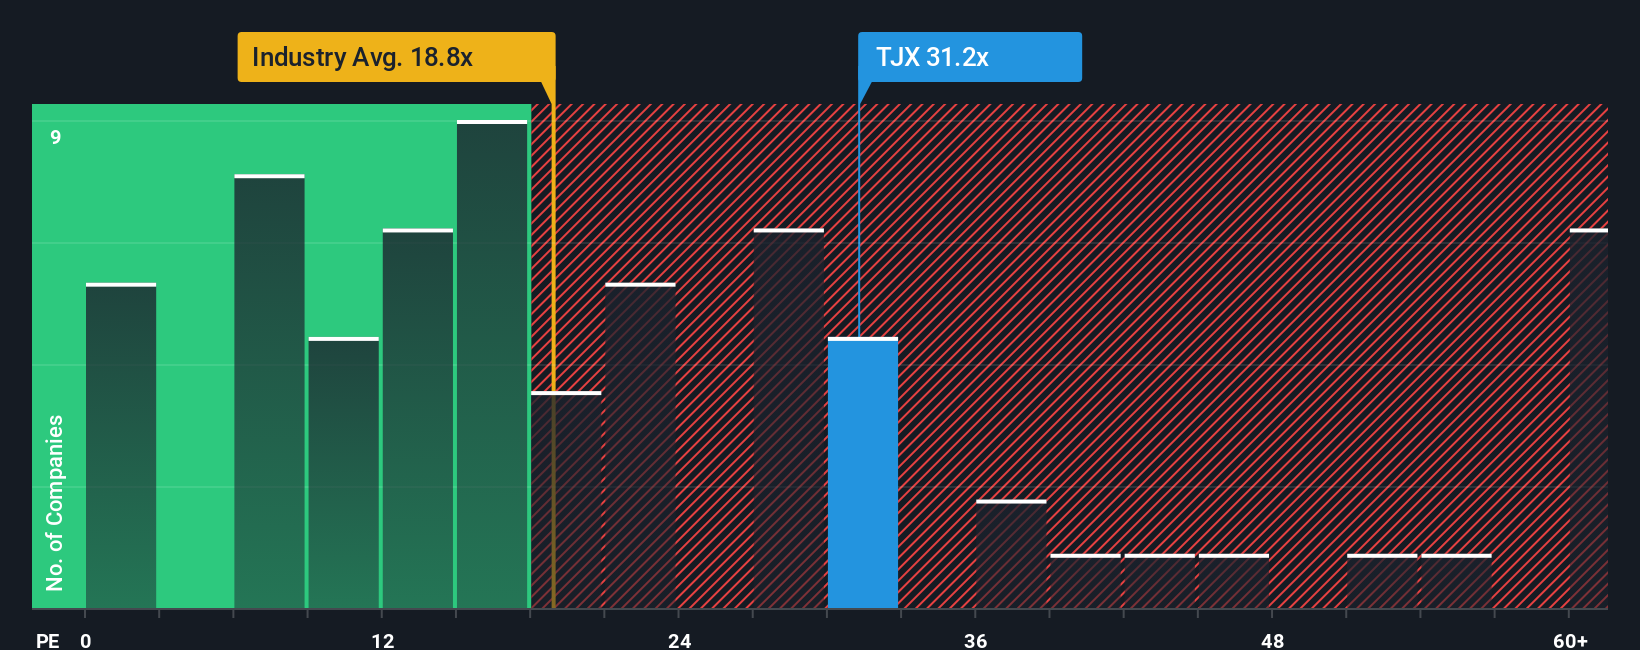
Higher growth expectations or lower perceived risk usually support a higher “normal” P/E, while slower growth or higher risk tend to justify a lower one. TJX is currently trading on a P/E of 33.39x, compared with the Specialty Retail industry average of 20.67x and a peer group average of 22.57x, so the shares are on a richer multiple than these broad benchmarks.
Simply Wall St’s Fair Ratio for TJX is 21.70x, which is its proprietary view of what a reasonable P/E could be given factors such as earnings growth, profit margins, industry, market cap and identified risks. This tailored yardstick can be more informative than a simple comparison to peers or the sector because it tries to align the multiple with the company’s own characteristics. Set against the current 33.39x P/E, the Fair Ratio points to TJX trading above this implied range.
Result: OVERVALUED
P/E ratios tell one story, but what if the real opportunity lies elsewhere? Discover 1450 companies where insiders are betting big on explosive growth.
Upgrade Your Decision Making: Choose your TJX Companies Narrative
Earlier we mentioned that there is an even better way to understand valuation. On Simply Wall St’s Community page you can use Narratives, which let you spell out your own story for TJX Companies, link that story to specific assumptions for future revenue, earnings and margins, translate those into a Fair Value you can compare directly with the current share price, and then see that view update automatically when new news or earnings arrive, whether you lean closer to a more cautious fair value around US$90 or a more optimistic view around US$181.
Do you think there's more to the story for TJX Companies? Head over to our Community to see what others are saying!
This article by Simply Wall St is general in nature. We provide commentary based on historical data and analyst forecasts only using an unbiased methodology and our articles are not intended to be financial advice. It does not constitute a recommendation to buy or sell any stock, and does not take account of your objectives, or your financial situation. We aim to bring you long-term focused analysis driven by fundamental data. Note that our analysis may not factor in the latest price-sensitive company announcements or qualitative material. Simply Wall St has no position in any stocks mentioned.
Have feedback on this article? Concerned about the content? Get in touch with us directly. Alternatively, email editorial-team@simplywallst.com