
- PREMIUM
- LIVE QUOTES
- INSTITUTIONS
 Index Options
 State Street
 CME Group
 Nasdaq
 Cboe
Cboe TradingView
 Wall Street Journal
Is Toyota Motor (TSE:7203) Pricing Make Sense After Recent Electrification Focus?
- If you are wondering whether Toyota Motor's current share price still offers value, you are not alone. This article unpacks what the market might be implying about the stock today.
- Toyota Motor shares last closed at JP¥3,331, with returns of 8.9% over the past 30 days and 12.0% over the past year. Over five years the gain is 144.8%, while year to date the stock is at a 2.0% decline and the 7 day return is a 0.7% decline.
- Recent attention on Toyota Motor has focused on how a major global automaker is approaching areas like electrification, supply chains and product mix. These factors can influence how investors think about its long term prospects and risk. These themes have been at the center of news coverage and often sit in the background when the share price moves over shorter periods.
- On our simple 6 point valuation checklist, Toyota Motor scores a 3 out of 6. Next we look at what different valuation methods suggest about that score before finishing with a more useful way to think about the company's value.
Find out why Toyota Motor's 12.0% return over the last year is lagging behind its peers.
Approach 1: Toyota Motor Discounted Cash Flow (DCF) Analysis
A Discounted Cash Flow, or DCF, model estimates what a company might be worth by forecasting its future cash flows and then discounting those back to today. It uses the idea that cash received in the future is worth less than cash in hand now.
For Toyota Motor, the model used is a 2 Stage Free Cash Flow to Equity approach. The latest twelve month free cash flow is reported as a loss of ¥467.3b. Analysts provide explicit forecasts for the first few years, and Simply Wall St then extrapolates further out, with projected free cash flow of ¥2,736.0b in the year to March 2030. These future cash flows, including the ten year projections, are then discounted to reflect risk and the time value of money.
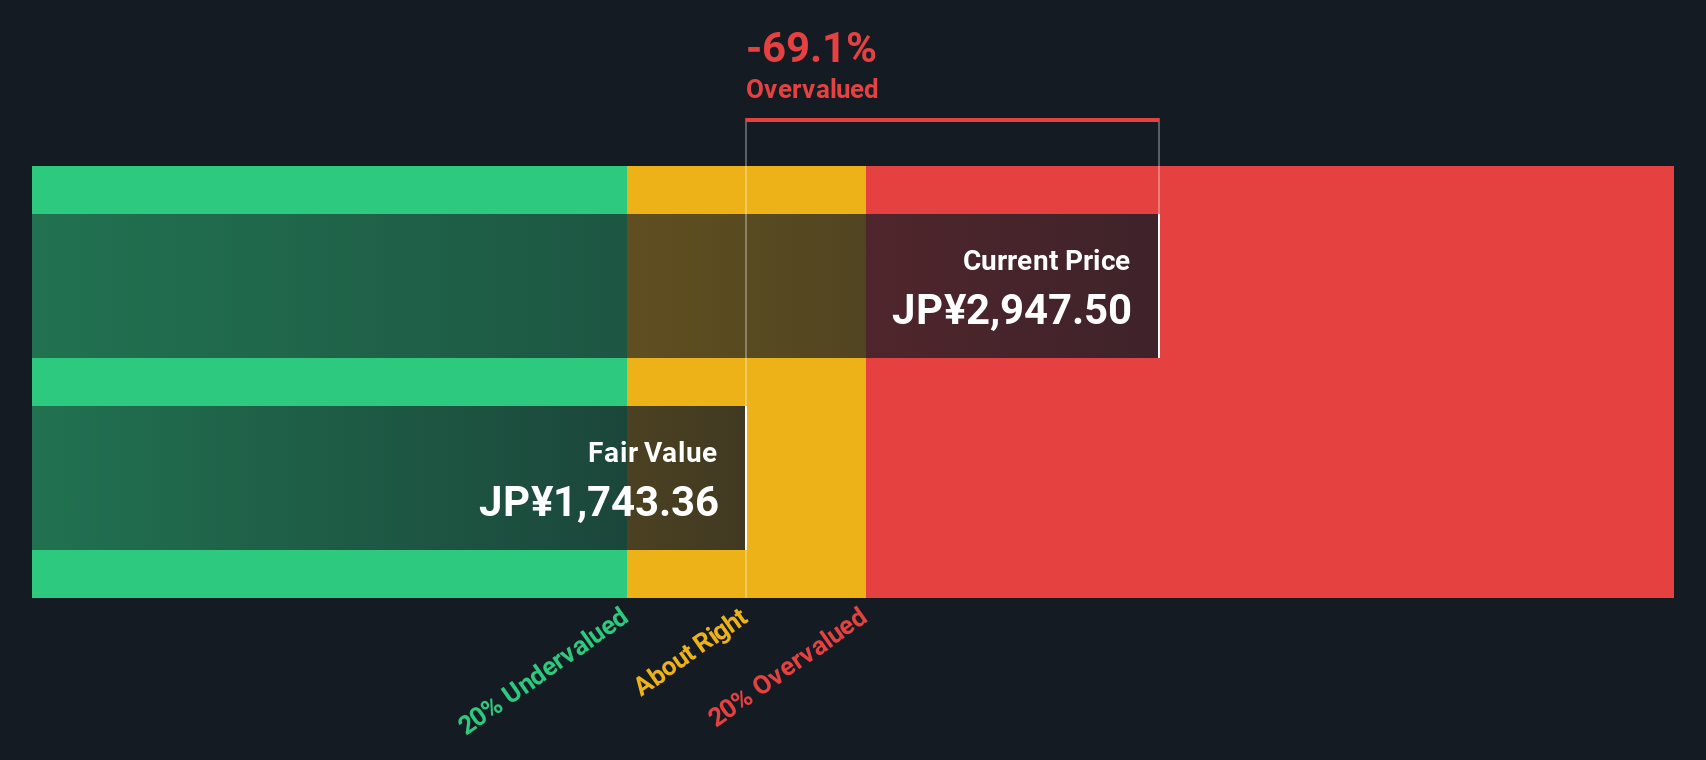
On this basis, the DCF model arrives at an estimated intrinsic value of ¥1,955.23 per share. Compared with the recent share price of ¥3,331, this suggests Toyota Motor is around 70.4% overvalued according to this set of assumptions.
Result: OVERVALUED
Our Discounted Cash Flow (DCF) analysis suggests Toyota Motor may be overvalued by 70.4%. Discover 873 undervalued stocks or create your own screener to find better value opportunities.
Approach 2: Toyota Motor Price vs Earnings
For profitable companies like Toyota Motor, the P/E ratio is a common way to think about value because it links what you pay per share to the earnings that each share generates. Investors often accept a higher or lower P/E depending on their expectations for future growth and how risky they feel those earnings are.
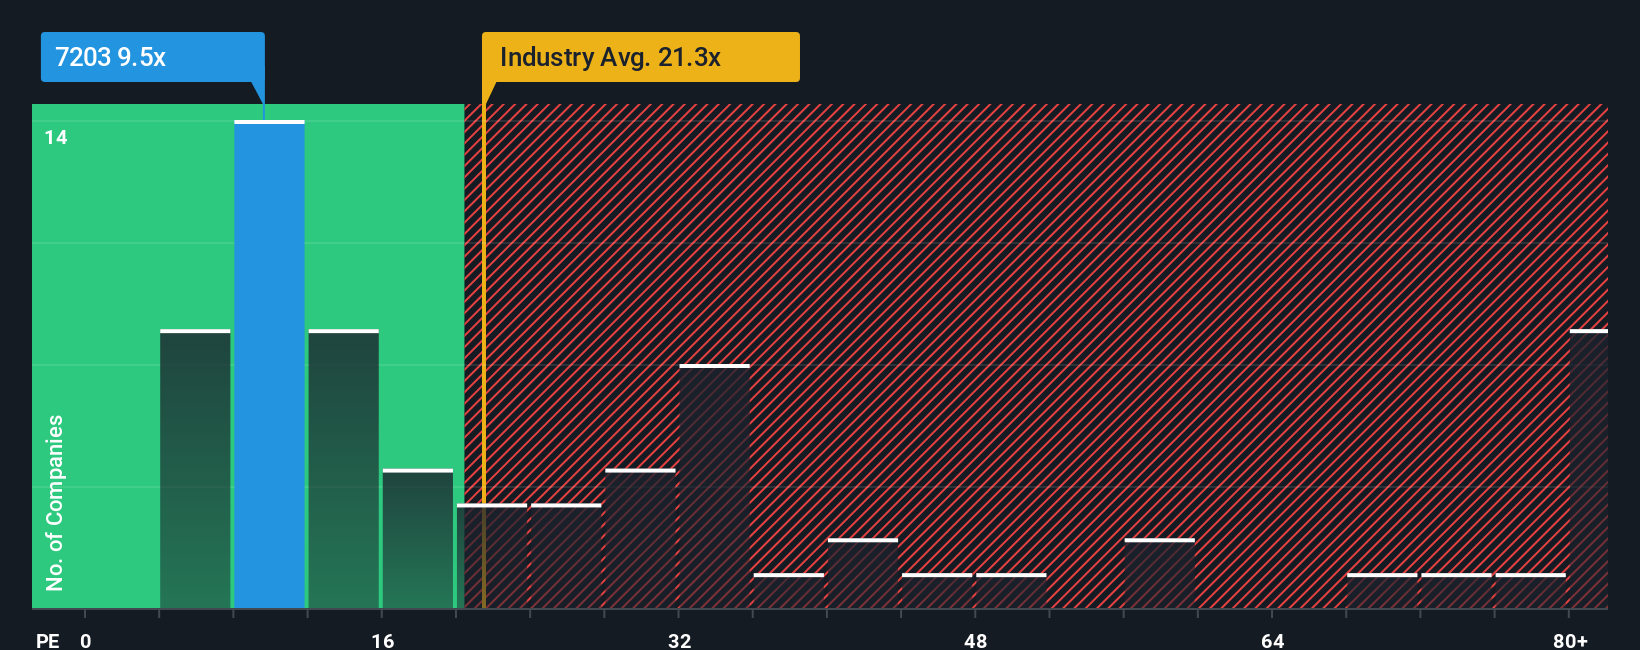
Toyota Motor currently trades on a P/E of 9.37x. That sits below the Auto industry average P/E of 18.59x and also below the peer group average of 10.44x. On the surface, that suggests the market is applying a lower earnings multiple to Toyota Motor than to many other auto companies.
Simply Wall St also calculates a proprietary “Fair Ratio” for Toyota Motor of 16.79x. This is an estimate of what the P/E might be given factors such as the company’s earnings growth profile, its industry, profit margins, market cap and specific risks. Because it is tailored to the company, the Fair Ratio can be more informative than a simple comparison with peers or the broad industry, which may not share the same characteristics. With the current P/E of 9.37x sitting below the Fair Ratio of 16.79x, Toyota Motor appears undervalued on this metric.
Result: UNDERVALUED
P/E ratios tell one story, but what if the real opportunity lies elsewhere? Discover 1449 companies where insiders are betting big on explosive growth.
Upgrade Your Decision Making: Choose your Toyota Motor Narrative
Earlier we mentioned that there is an even better way to understand valuation. On Simply Wall St's Community page you can use Narratives, where you write a simple story for Toyota Motor that links your view on its business drivers, such as battery investments in North Carolina or the impact of lawsuits, to a financial forecast for revenue, earnings and margins. You can then link this to a Fair Value that you can compare with the current share price to decide whether you see the stock as attractive or expensive. That Fair Value updates automatically as new earnings or news arrive. Different investors might reasonably land at very different numbers, for example closer to ¥2,400 if they focus mainly on production risks and legal uncertainty, or nearer to ¥3,400 if they give more weight to factors like electrified vehicle demand and the current ¥3,515 Fair Value estimate.
Do you think there's more to the story for Toyota Motor? Head over to our Community to see what others are saying!

This article by Simply Wall St is general in nature. We provide commentary based on historical data and analyst forecasts only using an unbiased methodology and our articles are not intended to be financial advice. It does not constitute a recommendation to buy or sell any stock, and does not take account of your objectives, or your financial situation. We aim to bring you long-term focused analysis driven by fundamental data. Note that our analysis may not factor in the latest price-sensitive company announcements or qualitative material. Simply Wall St has no position in any stocks mentioned.
Have feedback on this article? Concerned about the content? Get in touch with us directly. Alternatively, email editorial-team@simplywallst.com