
A Look At James Hardie Industries (ASX:JHX) Valuation After Renewed Confidence In Margins And Construction Demand
James Hardie Industries (ASX:JHX) has drawn fresh attention after a multi month rally that brought the stock close to its 52 week highs, as investors focus on margin discipline and resilient North American construction demand.
See our latest analysis for James Hardie Industries.
At A$31.35, the stock has a 1 month share price return of 5.48%, even though the 90 day share price return is a 5.69% decline and the 1 year total shareholder return is a 37.43% loss. Recent momentum is improving off a weaker longer term base as sentiment around margins and North American demand has improved.
If this kind of move has you reviewing building and construction exposure, it can be a good moment to broaden your search with fast growing stocks with high insider ownership.
Analysts still see some upside from here, and James Hardie’s own value score is at the lower end, which hints at potential mispricing. So is the current rally just catching up to fair value, or is the market already taking future growth into account?
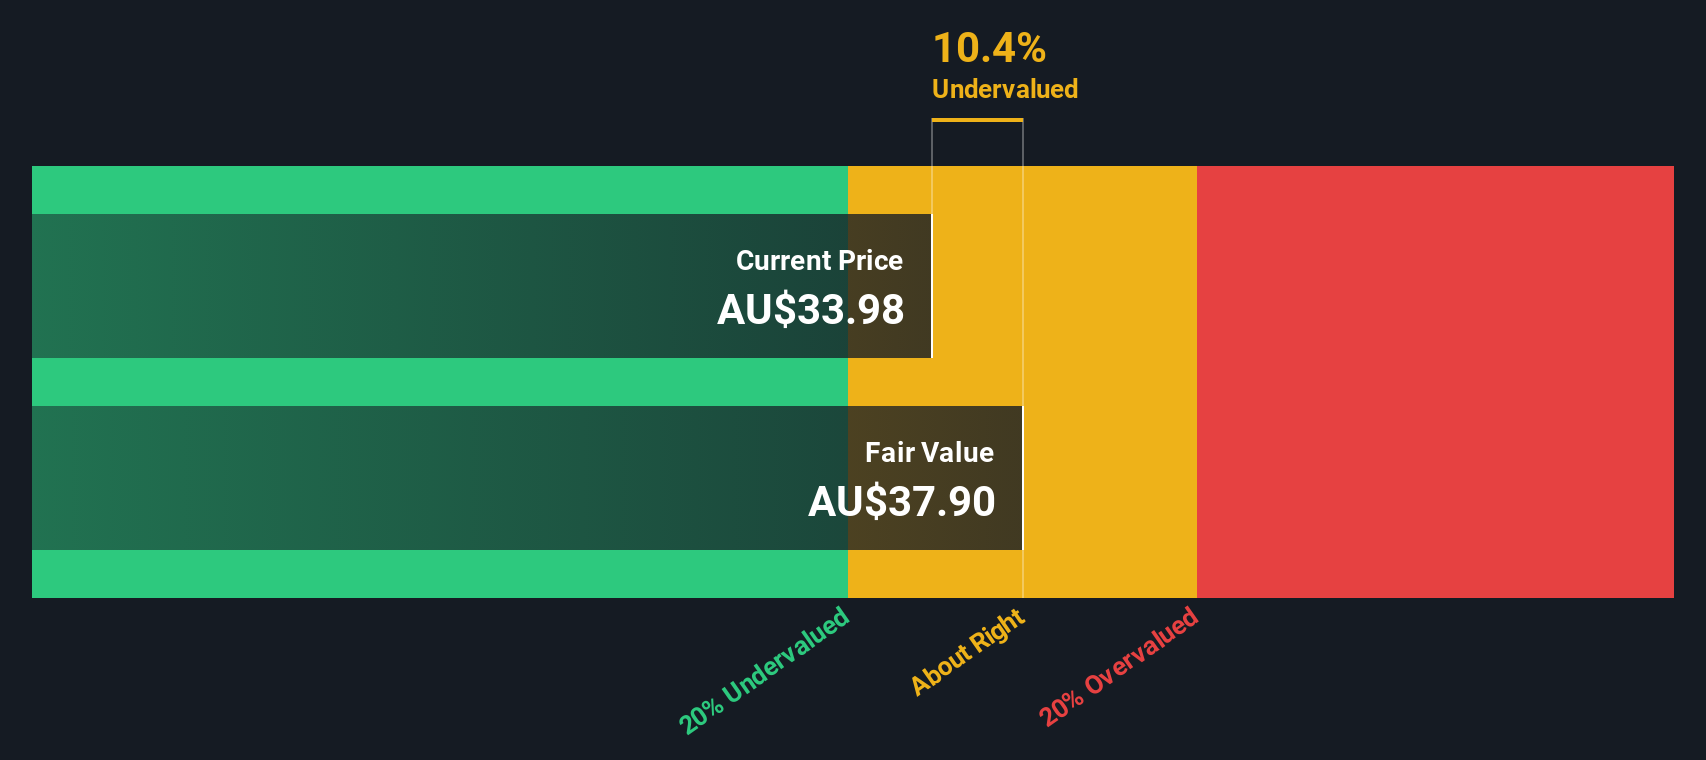
Most Popular Narrative: 9.9% Undervalued
Compared with the last close at A$31.35, the most followed narrative points to a higher fair value, anchored in growth, margins and capital intensity.
Synergy capture from the AZEK merger is already showing tangible cost reductions, with management reaffirming cost savings targets ($125 million over 3 years) and planning for over $500 million of commercial synergies within 5 years, providing clear visibility to EBITDA margin expansion and earnings growth.
Curious what kind of revenue build, margin reset and earnings multiple are baked into that fair value, and how aggressive those assumptions really are? The full narrative lays out a detailed earnings bridge, links it to a richer product mix, and then applies a future P/E that might surprise you.
According to the most popular narrative, James Hardie’s fair value sits around A$34.81, based on projected revenue growth, higher profit margins and an updated discount rate of 9.74%. That view leans on expectations for faster top line expansion, improved earnings power and a lower long run earnings multiple than previously used to justify today’s valuation gap.
Result: Fair Value of $34.81 (UNDERVALUED)
Have a read of the narrative in full and understand what's behind the forecasts.
However, the story could change quickly if housing demand softens further or if AZEK integration issues weigh on margins and push that earnings bridge off track.
Find out about the key risks to this James Hardie Industries narrative.
Another View: DCF Flags Overvaluation, Not Upside
While the consensus narrative sees James Hardie as roughly 9.9% undervalued at A$34.81, our DCF model presents a different view. On those inputs, fair value sits closer to A$27.19, which would leave the current A$31.35 price looking expensive rather than cheap. Which set of assumptions do you trust more?
Look into how the SWS DCF model arrives at its fair value.
Simply Wall St performs a discounted cash flow (DCF) on every stock in the world every day (check out James Hardie Industries for example). We show the entire calculation in full. You can track the result in your watchlist or portfolio and be alerted when this changes, or use our stock screener to discover 877 undervalued stocks based on their cash flows. If you save a screener we even alert you when new companies match - so you never miss a potential opportunity.
Build Your Own James Hardie Industries Narrative
If you are not convinced by these narratives or simply want to test your own assumptions against the same data, you can quickly build a personalised view in just a few minutes with Do it your way.
A great starting point for your James Hardie Industries research is our analysis highlighting 1 key reward and 4 important warning signs that could impact your investment decision.
Ready for more investment ideas?
If James Hardie has you thinking harder about where your money works best, do not stop here, your next opportunity could be sitting in plain sight.
- Spot potential bargains by scanning these 877 undervalued stocks based on cash flows that line up strong cash flows with prices that may not fully reflect them yet.
- Ride powerful tech themes by checking out these 25 AI penny stocks that are leaning into artificial intelligence across different parts of the economy.
- Tap into high income potential by reviewing these 11 dividend stocks with yields > 3% that combine sizeable yields with listed stock exposure.
This article by Simply Wall St is general in nature. We provide commentary based on historical data and analyst forecasts only using an unbiased methodology and our articles are not intended to be financial advice. It does not constitute a recommendation to buy or sell any stock, and does not take account of your objectives, or your financial situation. We aim to bring you long-term focused analysis driven by fundamental data. Note that our analysis may not factor in the latest price-sensitive company announcements or qualitative material. Simply Wall St has no position in any stocks mentioned.
Have feedback on this article? Concerned about the content? Get in touch with us directly. Alternatively, email editorial-team@simplywallst.com